Differences in Peripheral and Central Tissue Values: 15-PGDH Activity and PGE2 Measurement
This study investigates the differences in 15-PGDH activity and PGE2 levels between peripheral and central tissues of 20 colorectal cancer liver metastases (CRCLM). Box and whisker plots illustrate the median, inter-quartile range, and absolute differences in metabolic activity. The analysis reveals significant variations in COX-2 and 15-PGDH expression, highlighting the need for considering tissue location in therapeutic strategies. The data includes measured units in pmol/mg and arbitrary units, emphasizing the distinct biochemical profiles of tumor microenvironments.

Differences in Peripheral and Central Tissue Values: 15-PGDH Activity and PGE2 Measurement
E N D
Presentation Transcript
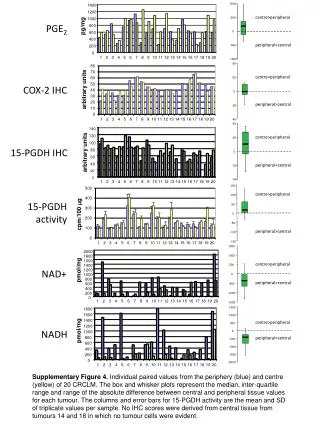
1000 1400 centre>peripheral 1200 500 1000 PGE2 pg/mg 800 0 600 peripheral>central 400 -500 200 0 -1000 1 2 3 4 5 6 7 8 9 10 11 12 13 14 15 16 17 18 19 20 centre>peripheral COX-2 IHC arbitrary units 40 peripheral>central 20 0 40 centre>peripheral -20 140 120 20 -40 100 15-PGDH IHC arbitrary units 80 0 peripheral>central 60 40 -20 20 0 -40 centre>peripheral 1 2 3 4 5 6 7 8 9 10 11 12 13 14 15 16 17 18 19 20 150 100 15-PGDH activity 50 cpm/100 mg peripheral>central 0 -50 1500 2000 -100 1800 1000 pmol/mg 1600 centre>peripheral -150 1400 500 NAD+ 1200 1000 0 800 peripheral>central 600 -500 400 200 -1000 0 1 2 3 4 5 6 7 8 9 10 11 12 13 14 15 16 17 18 19 20 -1500 1500 1800 1600 1000 pmol/mg centre>peripheral 1400 500 1200 NADH 0 1000 peripheral>central 800 -500 600 -1000 400 200 -1500 0 -2000 1 2 3 4 5 6 7 8 9 10 11 12 13 14 15 16 17 18 19 20 Supplementary Figure 4. Individual paired values from the periphery (blue) and centre (yellow) of 20 CRCLM. The box and whisker plots represent the median, inter-quartile range and range of the absolute difference between central and peripheral tissue values for each tumour. The columns and error bars for 15-PGDH activity are the mean and SD of triplicate values per sample. No IHC scores were derived from central tissue from tumours 14 and 18 in which no tumour cells were evident.