Download
1 / 25
250 likes | 469 Views
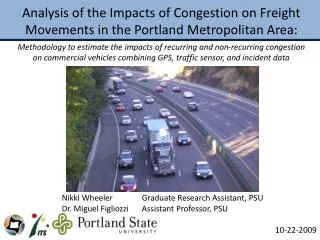
Analysis of the Impacts of Congestion on Freight Movements in the Portland Metropolitan Area:. Methodology to estimate the impacts of recurring and non-recurring congestion on commercial vehicles combining GPS, traffic sensor, and incident data. Nikki Wheeler Graduate Research Assistant, PSU

E N D
Analysis of the Impacts of Congestion on Freight Movements in the Portland Metropolitan Area: Methodology to estimate the impacts of recurring and non-recurring congestion on commercial vehicles combining GPS, traffic sensor, and incident data Nikki Wheeler Graduate Research Assistant, PSU Dr. Miguel Figliozzi Assistant Professor, PSU 10-22-2009
Introduction Supply Chain • Projected Growth will Increase Delay and Congestion • Delay and Congestion Impact Freight Industry • Timely deliveries • Increase in emission • Increase in cost • Difficulty scheduling • Currently, No Freight Performance Measures (FPM) • Early focus on passenger vehicles • (Schofield and Harrison, 2007) • Current measures may not meet needs of all users (e.g., loop sensors) • Better understanding of Freight reliability = Better planning/engineering • OBJECTIVE: Develop tools for measuring impacts of congestion on Freight $ PARTS $ $ $ DELAY Manufacture Distribution Retailer & Customer 2
Outline • Background/Context of problem • Description of Data Sources • Methodology • Case Study Results • Recurring Congestion • Non-Recurring Congestion • Conclusions 3
Background • Performance Measures • Tools to evaluate current/future needs • Travel time, speed, travel time reliability (NCHRP, 2006) • GPS Technologies • Travel Time Reliability & Bottlenecks • (ATRI, 2005), (ATRI, 2009), (Kamran and Hass, 2007) • Electronic Truck Transponders (Weigh-in-Motion) • Many freight vehicles needed • (McCormack and Hallenbeck, 2006) • Rural areas in Oregon • (Monsere et al., in Progress at PSU) • PSU direct access to Loop Sensor data from Oregon DOT • Recurring, Non-Recurring studies • (Monsere et al., 2006), (Bertini et al., 2005), • (Wieczorek et al., 2009) 4
Background cont. • Unique Contributions of this Work • Combining Multiple Data Sources • GPS data from commercial trucks • Loop sensor data (Oregon DOT) • Incident data (ODOT ATMS) • Create unbiased FPM • Separating trucks experiencing congestion vs rest/refuel • Develop alternatives to current PM Oregon Freight Data Mart • Useful to Public Agencies • Oregon Freight Data Mart • in Development at PSU (Figliozzi and Tufte, 2009) • Web-based platform • Available to commercial • & private carries 5
Description of Data Sources Available • PORTAL (SEE: http://portal.its.pdx.edu ) • Loop Sensor Data from ODOT • Incident Data • Type, Severity, Approximate location, • Start/End time (duration) • GPS Truck Data • TruckID number, Date, Time • Position (Latitude/Longitude) • Data Challenges • No common gap time btw readings • Multiple trips on same day • Different truck types (travel behavior) Northbound I-5 Loop Stations 6
Description of Data Sources Available cont. • GPS Truck Types • Through • Partial Through • Partial Local • Local • Develop Filter to ID Through Trucks • Best Representation of Corridor Congestion • Use Through Trucks to develop FPM SB Start of Corridor NB End of Corridor Distribution Center/ Truck Stop N GPS Reading 7 Corridor Length Interstate North/Southbound SB End of Corridor NB Start of Corridor
NB End of Corridor Methodology me = End Mile • Purpose of Filter: To Identify Through Trucks for analysis • Two Step Process: • Filter Process 1: Matching GPS Readings to Identify Potential Through Trucks • Filter Process 2: Comparison to PORTAL Average Speeds • Integrates available data sets and ensures no stops midway for rest/refuel Interstate North/Southbound tc Corridor Length = | me - ms | Filter Parameters ms= Start Milepost me = End Milepost r = Buffer radius tb = Threshold to clear buffer tc = Threshold to clear corridor and buffer tb ms = Start Mile N NB Start of Corridor r 8 r
Methodology cont. TruckID = 001 • Filter Process 1: Matching GPS Readings to Identify Potential Through Trucks • Obtain milepost measures using ArcGIS • Determine msand me • Look at points falling in buffer ranges • Distinguish individual trips by each truck using time thresholds tc and tb and identify the “start” and “end” points of each trip • Match readings in “start” buffer to downstream reading in “end” buffer occurring within tc me = End Mile tc Corridor Length = | me - ms | ms = Start Mile tb r r
Methodology cont. • Filter Process 1: Matching GPS Readings to Identify Potential Through Trucks • 6. Find all intermediate readings for a truck ID falling between the trip “start” and “end” readings • 7. Adjust the “start” and “end” reading timestamp and milepost to begin at ms and me using speeds obtained from the next closest reading • 8. Obtain the travel time and speed through the corridor, and identify trip direction using milepost data me = End Mile tc Corridor Length = | me - ms | ms = Start Mile tb r r
Methodology cont. • Filter Process 2: Comparison to PORTAL Average Speeds • Data sorted by the “start” reading timestamp into time bins of 15 minute intervals. • Deviation Index is calculated using the PORTAL: • For a 15 minute time bin t , • Then the Deviation Index gk is defined as • gk = | at – sk |/ σt • Where: • at = PORTAL average speed at time bin t • σt = PORTAL day-to-day standard deviation • sk = the corridor average speed for truck trip k • Truck trip is too far from the expected average if: • gk > m * σ • Where: • m = a user defined parameter
Methodology cont. Filter Process 2: Comparison to PORTAL Average Speeds
Methodology cont. Filter Process 2: Comparison to PORTAL Average Speeds
Case Study: Recurring Congestion Study Area • Recurring Congestion • I-5 NB • Wilsonville, OR to Vancouver, WA • 31.75 miles • December 8th-12th , 2008 (weekdays) PORTAL Loop Stations 14
Results: Recurring Congestion • Summary of Findings: • PORTAL tends to underestimate congestion • Std Err indicates less reliability in PM Peak (4-6PM) 15
Vancouver Case Study: Non-Recurring Congestion • Non-Recurring Congestion • Similar Methodology, • 5 mile segment S of incident “A” • Incidents Downstream of “A” MP 304.4 Alberta St A MP 303.88 Going St Portland 5 MI • Comparison btw Through-Incident Trucks • And Partial-Through/Local & Through PORAL Loop Station Incident “A” Downstream Incidents GPS Range 16
Results: Non-Recurring Congestion • Summary of Findings: • Downstream incidents have effect • Smaller Std Err with Through- Incident only • Supports that bias exists when partial/local movements included A 18
Truck Data vs PORTAL Comparison R2 = 0.7685 19
Truck Data vs PORTAL Comparison GPS Through-Incident vs PORTAL R2 = 0.836 GPS Partial/Through-Incident vs PORTAL R2 = 0.721 20
Research Next Steps • Work to-date is a good foundation… • Improving complexity of programming • Using PORTAL data dynamically • Statistical and Sensitivity Testing 21
Conclusions • Integrated GPS, loop sensor and incident data • New methodology to identify local and through trucks • Remove bias of trucks resting/refueling • Through trucks best indicator of congestion • Indications that loop sensor data may underestimate congestion • Performance data useful to public agencies • Expand to look at bottlenecks • Study greater time periods • Local/freeway transitions • Could be incorporated into Oregon Freight Data Mart or other web based platform 22
Acknowledgements The authors would like to thank Jeffrey Short from the American Transportation Research Institute for his help in acquiring and dealing with GPS data. The author gratefully acknowledges the Oregon Transportation, Research and Education Consortium (OTREC) and Federal Highway Administration for sponsoring this research. The authors would like to thank Shreemoyee Sarkar, graduate research assistant at the College of Engineering and Computer Science, Portland State University, for assisting in the development of the filtering program to identify through trucks. Any errors or omissions are the sole responsibility of the authors. 23
Questions?? 24
References BERTINI, R., HANSEN, S., BYRD, A. & YIN, T. (2005) PORTAL: Experience Implementing the ITS Archived Data User Service in Portland, Oregon. Transportation Research Record: Journal of the Transportation Research Board, 1917 2005:90-99. ERDG (2005) The Cost of Congestion to the Economy of Portland Region, Economic Research Development Group. December 2005. Available from http://www.portofportland.com/Trade_Trans_Studies.aspx ERDG (2007) The Cost of Highway Limitations and Traffic Delay to Oregon’s Economy. March 2007. Available from: http://www.portofportland.com/Trade_Trans_Studies_CostHwy_Lmtns.pdf FIGLIOZZI, M. & TUFTE, K. (2009) A Prototype for Freight Data Integration and Visualization Using Online Mapping Software: Issues, Applications, and Implications for Data Collection Procedures. Transportation Research Board Annual Meeting 2009. KAMRAM, S. & HAAS, O. (2007) A Multilevel Traffic Incidents Detection Approach: Identifying Traffic Patterns and Vehicle Behaviours using real-time GPS data. Intelligent Vehicles Symposium, 2007, IEEE; 2007; 2007. p. 912-917. MCCORMACK, E. & HALLENBECK, M. E. (2006) ITS Devices Used to Collect Truck Data for Performance Benchmarks. Transportation Research Record 2006;1957:43-50. MONSERE, C. et al. (2006) Validating Dynamic Message Sign Freeway Travel Time Messages with Ground Truth Geospatial Data. Transportation Research Record: Journal of the Transportation Research Board 2006;1959:19-27. MONSERE, C., WOLFE, M. & ALAWAKIEL, H. (2009) Using Existing ITS Commercial Vehicle Operations (ITS/CVO) Data to Develop Statewide (And Bi-State) Truck Travel Time Estimates and Other Freight Measures. In Preparation at Portland State University. MURRAY, D., JONES, C. & SHORT, J. (2005) Methods of Travel Time Measurement in Freight-Significant Corridors. American Transportation Research Institute. NCHRP (2006) Performance Measures and Targets for Transportation: National Cooperative Highway Research Program, Transportation Research Board; 2006. Report No. 551. SCHOFIELD, M. & HARRISON, R. (2007) Developing Appropriate Freight Performance Measures for Emerging Users; September 2007. Report No. SWUTC/07/473700-00073-1. SHORT, J., PICKETT, R. & CHRISTIANSON, J. (2009) Freight Performance Measures Analysis of 30 Freight Bottlenecks. Atlanta, GA. WIECZOREK, J., HUAN, L., FRENANDEX-MONTEZUMA, R. & BERTINI, R. (2009) Integrating an Automated Bottleneck Detection Tool into an Online Freeway Data Archive. Transportation Research Board Annual Meeting 2009. 25