Download
1 / 67
670 likes | 861 Views
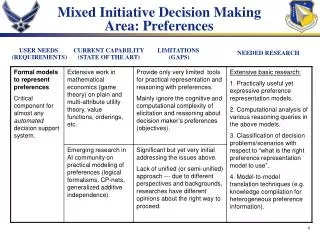
User Needs and User Profiling. User Population. Target “Novice” Level. Target “Expert” Level. High Performance. Low Performance. “Single View”. Any single view of the User is incomplete, whether it is the novice, average, or expert Each view only captures a limited number of users

E N D
User Population Target “Novice” Level Target “Expert” Level High Performance Low Performance
“Single View” • Any single view of the User is incomplete, whether it is the novice, average, or expert • Each view only captures a limited number of users • The implemented design may actually hurt the performance of the other non-represented users. • Representing all of the Users individually is not cost effective. • A reasonable number of views (3 to 5) has high leverage. Small enough to be definable, but large enough for coverage.
Behaviors - Strategies Basic Call + Up Selling = Total Revenue • Rep 1 : + = • Rep 2: + =
User Models Modeling Approach: • The first step is to categorize the service representatives’ behaviors into clusters. • The second step is to objectively and quantitatively describe the service representatives’ behaviors and strategies. • The third step is to create a model for each of those clustered behaviors. • Simulate the models to determine impact.
Performance by Group High “Blue” “Yellow” Monthly Sales “Orange” “Purple” Low Few Many Offers per Call
Qualitative User Models Blue Group • Very few cross sell attempts • Efficient call takers, shortest call duration • Most likely do only what the customer requests • High Revenue Yellow Group • Moderate number of cross sell attempts • Moderate call duration • High Revenue
Comments • Large, diverse user-populations can be categorized into distinctive groups. • Top performers may use different strategies and those behaviors need to be understood. • Models reflect factors that are important in achieving business goals. • Models can be constructed of those behaviors. • Models should be integrated with interface design and operational improvement.
Customer-Centric • Customer-Centric approach takes the customer’s view or perspective in accomplishing tasks. • Frequently, organizations focus on the business, department, or process perspective. Organizations concentrate on the processes, people, and technologies that must interact to address the customer’s request and ultimately accomplish the customer’s task. • The goal is to have the Customer routed to the most appropriate location (agent) where the customer can on their own, or with our assistance, accomplish their desired task with the highest level of satisfaction at the least amount of cost.
Customer has Mapping Burden Customer’s Contacts Customer’s Expressions Interface Task Completion “Want Caller ID” MENU For Service Order Center, press 1. For Billing Inquiry Center, press 2. For Revenue Management Center, press 3. “Orders” “Need a 2nd line” “Billing” “Don’t understand my bill” ? “Collections” “Reconnect phone” How many? 1,000,000s How many? 100,000s How many? 10
System has Mapping Burden Customer’s Contacts Customer’s Expressions Task Categories Interface Task Completion “Want Caller ID” MENU To order service, such as caller id or a second line, press 1. To get billing information, press 2. To reconnect your services, press 3. “Order Service” “Orders” “Need a 2nd line” “Don’t understand my bill” “Get Bill Information” “Billing” “Reconnect phone” “Reconnect Services” “Collections” How many? 1,000,000s How many? 100,000s How many? 100 How many? 10
Customer has Mapping Burden Customer’s Contacts Customer’s Expressions Action- Object Routing Table Task Completion “Want Caller ID” “Acquire-Optional Service” “Orders” “Need a 2nd line” “Don’t understand my bill” “Inquire-Bill” “Billing” “Reconnect- Basic” “Reconnect phone” “Collections” How many? 1,000,000s How many? 100,000s How many? 100 How many? 20
Customer-Centric Design Customer-Centric approach uses the customer task as the primary influence on interface design. • Menu items would directly match tasks that customers are trying to accomplish. • Menu items would be grouped and ordered by frequency of customer tasks. • Menu items would be worded in the language of the customer.
Performance Realities • All interface technologies have limitations. A given interface technology (e.g. IVR systems) can achieve a certain level of customer satisfaction and a certain level of performance (e.g. accomplish their task). All interface technologies will have less than perfect customer satisfaction and performance. • Customer-Centric approach will specify a design that maximizes the performance of a given interface technology. In other words, Customer-Centric approach delivers the best interface possible for a given interface technology.
5 Step Design Approach 1. Customer Task Frequency Table 2. Customer Perceptions for Interface Structure 3. Interface Design 4. Customer Usability Test 5. Refine Design for Implementation • Understand customer goals • Understand customer preferences • Design from user’s perspective • Lab tests & field evaluations • Reduce misdirects • Increase customer satisfaction
Step 1: Customer Tasks • Why do customers contact us ? • Customers want to accomplish a task. • What are those tasks ? • Gather data. • Customer’s opening statement provides an excellent snapshot of their (first, primary) task. • Gather sufficient number of tasks to be statistically valid. (e.g. 2,500) • Categorize tasks into Customer-Centric groupings. • Tabulate results and construct Frequency Table.
Customer Task Frequency Table Example Call Center
Task Mapping • Task Mapping = pair of words that captures the caller’s task concisely and unambiguously. • Task Mapping = “Action” / “Object” format. • Example Actions: pay, acquire, inquire. • Example Objects: bill, dsl, long_distance. • “I would like to pay my bill” = Pay-Bill • “Get new phone service to my home” = Acquire-Basic • Task Mapping is based upon a business model. • shop, purchase, pay, maintain, terminate
Step 2: Customer Perceptions • Card Sort Method: Customer’s perception of how customer tasks should be grouped into menu items. They are given the most frequent customer tasks and asked to categorize them into logical groups. • Procedure: • Sort (numbered) task cards into groups based on the similarity of tasks. • Rank groups in order of importance. • The more tasks are linked, the more they should be in the same menu structure.
Frequency of Use • How often do the customers visit the interface? • Frequent daily use. • Infrequent “walk up and use”. • Key behavior - do the customers remember the interface from one use to the next?
2. Add Optional Service 3. New Service/Open Account 4. How to Use 5. Disconnect Optional Service 7. Change Optional Service 8. Disconnect Services/Close Account 12. Move Service 22. Reconnect Service 24. Schedule a Move
1. Get Info about Bill 10. Schedule a Payment 13. Information on Account 14. Discuss Bill 15. Get Information on Payment 17. Where to Make a Payment 18. Give Information on Payment 19. Make a Payment
Step 3: Design Customer-Centric approach: • Customer Task Frequency Table identifies what topics should be included on the menu. • Card Sort identifies how to group menu items and how customers would structure the interface. • Customer Opening Statements identify how to word or what language to use in the menu items.
“Action-Object” in Design Rank order of design styles (best to worst): • Specific Action & Specific Object. (e.g. “order CallNotes”) • “No” Action & Specific Object. (e.g. “for CallNotes”) • Specific Action & General Object. (“order a service”) • General. (e.g. “speak to someone”)
Customer-Centric • Examples of Business-Centric menu items: • For orders, press 1. • For repair, press 2. • Examples of Customer-Centric menu items: • To get information about your account, or our services and prices, press 1. • To get new service, move, change, or disconnect your service, press 2. • To report a problem with your service, press 3.
“Cut Through” CRT Score Announcement Ann. A Ann. B 2 + 2 = 4 User Selection 1 3 Time in seconds 1 5 10 15 20 Announcement Ann. A Ann. A CRT Score 2 + 10 = 12 User Selection 9 3 Time in seconds 1 5 10 15 20 Ann. B Announcement Ann. A CRT Score - 3 + (-1) = -4 User Selection 1 3 Time in seconds 1 5 10 15 20
Step 4: Usability Testing • Testing reduces risk. No matter how well the interface has worked in the past or on other applications, testing is a relatively quick inexpensive approach to reducing the risk. • We set up a controlled experiment to ensure that implementation surprises are minimized. • Approximately 100 customers (actually 96) perform tasks using the interface in order to achieve statistically valid results. • Normally, more than one design (usually four) is tested and evaluated.
Step 5: Refine Design Performance Matrix • Provides a view of two important performance indicators (i.e. customer satisfaction and correct call routing). • Used to evaluate the performance of specific customer tasks.
Comments • Assume reported data is wrong. Or, at minimum, the data is not what it appears. Lesson: always validate and verify data before performing analysis. • Key Step: Compare predicted to observed.
Prompts with Examples • No Example: Welcome to SBC. I’m here to help you reach the right place. First, Please tell me the purpose of your call and then press the pound key. • Example: Welcome to SBC. I’m here to help you reach the right place. First, Please tell me the purpose of your call and then press the pound key. You can say things like, “What’s my account balance?” or “I’d like to get some rates for long distance.” So, how can I help you?