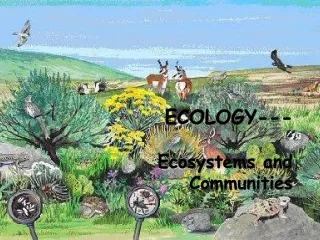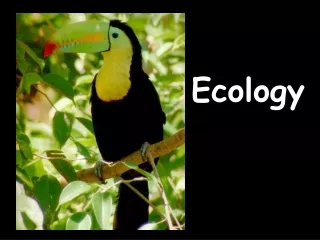
Ecology
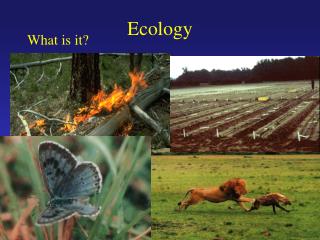
Ecology. Chapters 2-5. Ecology. Ecology - The study of the relationships and interactions among living organism Habitat - an area where an organism lives Niche - the role that an organism has in its environment. Limiting Factors. Biotic factors A. Any living limiting factor

Ecology
E N D
Presentation Transcript
Ecology Chapters 2-5
Ecology • Ecology - The study of the relationships and interactions among living organism • Habitat - an area where an organism lives • Niche - the role that an organism has in its environment
Limiting Factors • Biotic factors • A. Any living limiting factor • B. Examples: • 1. White-tail deer browse white pine seedlings • 2. Red-tailed hawks prey upon field mice
Limiting Factors • Abiotic factors • A. Any non-living limiting factor • B. Examples: • 1. Frost kills off mosquitoes • 2. Limited sunlight promotes spindly sp
Levels of Organization • 1. Atom • Smallest unit of organization • Bind together to form molecules • 2. Cell • unit of structure and function • example: muscle cell • 3. Tissue • cells working together to perform a function • example: muscle tissue
Levels of Organization • 4. Organ • several different tissues that function together • example: heart • 5. Organ System • several organs that work together • example: muscular system • 6. Organism • group of organ systems that work together • example: snapping turtle
Levels of Organization • 7. Population: • individuals of the same type that interbreed • 8. Community: • interacting populations same place and same time • 9. Ecosystem: • community and its physical environment • 10. Biome: • large group of ecosystems that share the same climate and have similar types of communities • 11. Biosphere: • the portion of earth that supports life
Interactions • Symbiosis - the relationship that exists when two or more organisms live together • 1. Predator-prey • a. Definition: prey is eaten by the predator • b. Example: mouse is eaten by rattlesnake • 2. Parasitism • a. Resembles predator-prey relationship • Similar in that a parasite feeds on a host • Different in that death does not result immediately • b. Examples: fleas, ticks, leeches, tapeworms
Interactions • 3.Competition • a. Definition: organisms strive for same limited resource • b. Example: intertidal zone barnacles • Chthalamuscan tolerate the entire intertidal zone • Semibalanuscan only tolerate only the lower region • 4. Mutualism • a. Definition: cooperative relationship, both benefit • b. Example: pollination • Pollinators gain nectar (food) from the flower • Flower pollen is spread by pollinators
Interactions • 5. Commensalism • a. Definition: one organism benefits, other is unaffected • b. Example: cattle egrets feed on small animals stirred up by Cape buffalo foraging in grass
Relationships • Autotroph - collects energy from sunlight, or inorganic substances • Heterotroph- organism that gets its energy from consuming other organisms (consumers) • Herbivore - heterotroph that only eats plants • Carnivore - heterotroph that only eats meat (animals) • Omnivore - heterotrophs that eat both plants and animals
Relationships • Trophic Level - a level in the flow of energy • Biomass - the total mass of living matter at each trophic level • Food Chain - shows how energy flows through an ecosystem • Food Webs - model representing the many interconnected food chains and pathways in which energy flows through a group of organisms
Energy Pyramid • Energy/Biomass/Numbers Pyramid - model used to show how energy flows through ecosystems • Each level shows the amount of substance that are contained in that level • Each step up in the pyramid is translates into a 90% loss • Only 10% of the energy is used in cellular processes
Energy Pyramid • Another way to say this is........ • When an animal eats another animal only 10% of the energy is transferred into usable energy by the new animal, the other 90% is lost
Water Cycle • Evaporation - • Condensation - • Precipitation - • Transpiration - • Percolation -
Imaginary Ecology • Side 1 • Cut your Imaginary plants and animals out and put them into your imaginary habitat • You will have to draw the background of the habitat (make a scene) • Connect your Imaginary plants and animals with lines showing a food chain, on the line write out the relationship (ex. Carnivore eats herbivore, Herbivore eats producer) • Also label which are heterotrophs and which are autotrophs
MN Ecology • Side 2 • Left half • List of MN plants and animals and a food web diagramming how they interact • Right half top quarter • MN ecology food pyramid • Right half bottom quarter • Water Cycle
Populations • Population Density - the number of organisms per unit area • Dispersion - the spacing of a population within an area • ex. uniform, clumped, random • Density - independent factor - any factor in the environment that does not depend on the number of members in specific area usually abiotic factors like weather, water, pollution, air • Density - dependant factors - any factor in the environment that depends on the number of members in a specific area • usually biotic factors like predation, disease, parasites, competition • Population growth rate - explains how fast a given population grows
Populations • Capture/Recapture Method - capture and recapture to determine the size of the populations • Suppose the population is of size N, so that N is the number we wish to estimate. Suppose, M organisms were captured, marked (or tagged) and released back into the population. After some time that should be sufficient for organisms to mix, n organisms were captured, and m of these appeared to be marked. The proportion of recaptured organisms is assumed to be the same as the portion of marked organisms
Population Equation • Equation = Marked recaptured/total recaptured = total captured/x
Populations • Carrying Capacity - maximum number of individuals of a species that an environment can support for the long term • Think of some factors that can effect the carrying capacity of an environment
TEST Info • 15 short answer questions • Ecology • Biotic/Abiotic Factors • Habitat/Niche • Community Interactions • Symbiotic Relationships • Autotroph/Heterotroph • Food Web/Food Chain/Pyramid • 10% rule • Biogeochemcial processes • Population Density/Population Limiting Factor • Capture/Recapture method • Carrying Capacity