Download

1 / 28
290 likes | 700 Views
SHEAR STRESS ANALYSIS IN A ROTATOR-STATOR SYSTEM. IX International PHOENICS Users Conference Moscow, 24 th September 2002. AUTHORS. Chemtech - A Siemens Company, Rio de Janeiro / RJ – Brazil Petrobras / CENPES, Rio de Janeiro / RJ – Brazil. Flávio Martins de Queiroz Guimarães

E N D
SHEAR STRESS ANALYSIS IN A ROTATOR-STATORSYSTEM IX International PHOENICS Users Conference Moscow, 24th September 2002
AUTHORS Chemtech - A Siemens Company, Rio de Janeiro / RJ – Brazil Petrobras / CENPES, Rio de Janeiro / RJ – Brazil Flávio Martins de Queiroz Guimarães Bruno de Almeida Barbabela Luiz Eduardo Ganem Rubião Ricardo Serfaty
INTRODUCTION – THE SYSTEM • Vertical axis rotating device with eight test plates attached submerged into a viscous medium. • Axial symmetric – just one eighth of it has been simulated.
COMPUTATIONAL GRID • The domain definition was one of the majors steps of the system setting-up. It was created as: • Body-fitted coordinates; • Multi-block approach; • Sliding interface between the blocks.
GENERAL SETTINGS • All simulations were run on PHOENICS v3.4. The follow configuration was setting: • Grid: Multi-block sliding-grid • Energy Equation: no • Turbulence Model: Low-Reynolds k- model • Transient: no • Relaxation: By GROUND implementation • Equation Formulation: GCV
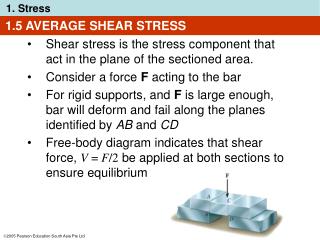
NEAR WALL SHEAR STRESS EVALUATION SHEAR STRESS
NEAR WALL VELOCITY GRADIENT • PROBLEM: • How to evaluate the near wall velocity gradients? SOLUTION: Finite – elements approach with a 6 (six) nodes quadrilateral element.
NEAR WALL VELOCITY GRADIENT For the solution of the gradient profile, the partial derivatives are solved as a sum of the variable node values pondered by the shape functions derived in respect to the spatial coordinates.
NEAR WALL VELOCITY GRADIENT • A bidimensional local coordinate system (R and S spatial directions) was defined based on the heterogeneous derivatives.As shown below:
NEAR WALL VELOCITY GRADIENT • First Case: NO WALL CONTACT
NEAR WALL VELOCITY GRADIENT • First Case: NO WALL CONTACT
NEAR WALL VELOCITY GRADIENT • Second Case: LOWER WALL
NEAR WALL VELOCITY GRADIENT • Second Case: LOWER WALL
NEAR WALL VELOCITY GRADIENT • Third Case: UPPER WALL
NEAR WALL VELOCITY GRADIENT • Third Case: UPPER WALL
ANALYTICAL VALIDATION The Couette Flow • This simulation consisted of the flow in the gap region between two concentric cylinders with the inner cylinder rotating with constant angular velocity , as shown in the figure below:
ANALYTICAL VALIDATION Assumptions & Constrains • For an ideal flow, the two assumptions below are taken as true: • In steady-state laminar flow, fluid moves following a fully circular profile with null radial and axial velocity components. • Since the system is axially symmetric, the pressure gradient in the angular direction is considered null.
ANALYTICAL VALIDATION Navier – Stokes Equations The solution of the Navier – Stokes Equations for a Couette like flow were described following:
ANALYTICAL VALIDATION Boundary Conditions For the case of inner cylinder rotating with angular velocity and the outer cylinder stationary: • At r = kR (inner rotating cylinder) v = kR • At r = R (outer cylinder) v = 0 Integrating the angular component between the boundary conditions limits:
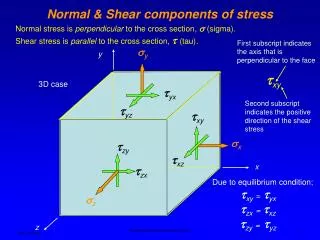
ANALYTICAL VALIDATION Shear Stress Components The shear stress components in cylindrical-polar coordinates are given by:
ANALYTICAL VALIDATION Shear Stress Evaluation • For a Couette flow in the gap region:
ANALYTICAL VALIDATION • Performed for an specific set of physical-chemical properties at a constant rotating speed. • Since the analytical solution is laminar, no turbulence model was considered in the simulation.
FIELD TEST VALIDATION The velocity profile and the rotating wall shear stress were compared for both cases in order to verify the precision of the system.
FINAL RESULTS • To provide more detailed and easy to get information about the resulting shear stress profile, additional code was programmed into GROUND file to print treated data to the end of the RESULT file. The following information is provided: • Average shear stress on the south surface (SAVG_in) and on north surface of the plate (SAVG_out); • Shear stress at the center of the plate on the south surface (SHST_in) and on the north surface (SHST_out); • Shear stress at each cell of the south surface (slab by slab); • Shear stress at each cell of the north surface (slab by slab);
CONCLUSIONS • The results showed good quantitative agreement with analytical data though several sweeps are need to guarantee the convergence. • Although the resulting shear stress profile for de k- turbulence model seems to fit better near the walls, it was more unstable and harder to converge than the standard k- one. • Also, it was verified that near the open borders of the plate the shear stress is usually higher because of an increase in the turbulence effects at these elements. It was important to point out that in some cases the shear stress near the borders seems to be over-predicted and unfortunately it was impossible to check experimentally this data
CONCLUSIONS • Finally this case was used as a base for a general q1 template and implemented in a Human-Machine Interface (HMI) in order to turn typical sensibility analysis into an easy task, allowing series of tests to be performed with very few clicks of the mouse. This enables even new users or equipment designers who may wish not to invest in training in PHOENICS to perform similar studies.