Pre- and Post-Injection Vertical Seismic Profiling in Fruitland Coal CO2 Pilot Test
Study on seismic profiles for CO2 injection in deep coal seams, identifying faults and fractures in Kirtland Shale and Fruitland Formation.

Pre- and Post-Injection Vertical Seismic Profiling in Fruitland Coal CO2 Pilot Test
E N D
Presentation Transcript
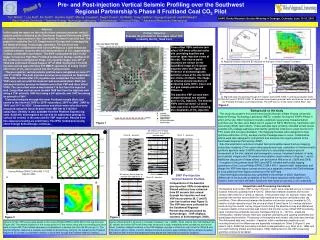
The Kirtland Shale primary seal (caprock) Fruitland Formation reservoir zone A. C) Migrated stack line passing through the injection well (COM A ING 1) and two production wells (COM A 300 and FC STATE COM). D) Enhanced view reveals potential faults and fracture zones within the Fruitland Formation and Kirtland Shale. The VSP was run in the center COM A ING 1 well. Pre- and Post-injection Vertical Seismic Profiling over the Southwest Regional Partnership’s Phase II Fruitland Coal CO2 Pilot Panel 1 Tom Wilson1,2, Les Nutt3, Ric Smith3, Jitendra Gulati3, Marcia Coueslan3, Dwight Peters3, Art Wells2, Craig Hartline4, George Koperna5 and Bill Akwari4 1 West Virginia University, 2 National Energy Technology Laboratory, 3 Schlumberger, 4 ConocoPhillips, 5 Advanced Resources International AAPG Rocky Mountain Section Meeting in Durango, Colorado, June 13-16, 2010 Abstract In this study we report on the results of pre and post injection vertical seismic profiles collected at the Southwest Regional Partnership (SWP) on Carbon Sequestration’s San Juan Basin Fruitland Coal pilot test. The project is funded by the U.S. Department of Energy and is managed by the National Energy Technology Laboratory. The pilot test was undertaken in collaboration with ConocoPhillips as a joint enhanced coalbed methane recovery test and demonstration of CO2 sequestration in deep, unmineable coal seams. The SWP conducted the pilot in the Upper Cretaceous High Rate Fruitland production fairway southwest of the northwest trending basin hinge. CO2 injection began July 30th of 2008 and continued through August 14th of 2009. During the 12 month injection period approximately 319 MMCF, equivalent to nearly 18,407 short tons of CO2 were injected into the Fruitland coals. The pre-injection vertical seismic profiles were completed on June 2nd and 3rd of 2008. The post injection surveys were acquired on September 17th, 2009: a month after CO2 injection was completed. The monitor VSPs were not run until the reservoir was pressured down. Both pre- and post-injection surveys included a zero offset VSP and three offset VSPs. The zero offset source was located 114 feet from the injection well. Long offset sources were located 1498 feet from the injection well along a 216o azimuth, 1693 feet along a 34o azimuth, and 1942 feet along an azimuth of 349o. Elemental analysis through the lower Fruitland reveals thick coal seams in the intervals 2950’ to 2970’ subsurface, 2975’ to 2986’, 3048’ to 3060’ and 3111’ to 3336’. Compression and shear wave velocities were measured using the Sonic Scanner from 285 feet to 3132 feet subsurface. Density is also available from the Platform Express log suite. Synthetic seismograms are used to tie subsurface geology to surface 3D seismic in the area and the VSP responses. Results from time lapse processing are preliminary. The WVU funded processing effort through Schlumberger continues . Primary Objective Evaluate the potential for time-lapse offset VSP to identify the CO2 flood front. Three offset VSPs and one zero offset VSP were collected at the site providing baseline and monitor (post-injection views of the site). The source point locations are shown on the QuickBird image at left (green squares) (also see Figure 3B). Presence of archaeologically sensitive areas at the site limited our choice of offsets. The image at left also shows locations of producing wells, NETL tracer and soil gas sample points and tiltmeters. The baseline VSP surveys were completed about two months prior to CO2 injection. The monitor VSPs were surveyed 1.3 years later, just over a month following the completion of CO2 injection. B. A. D. C. Figure 2 Background on the study The study discussed in this poster was funded through a West Virginia University/ National Energy Technology Laboratory (NETL) contract. During the SWP’s Phase II effort at the site, West Virginia University undertook several site characterization activities over the San Juan Basin pilot in support of NETL Monitoring, Verification and Accounting (MVA) team efforts. These activities were primarily intended to help locate possible CO2 leakage pathways and identify additional locations to place monitors for PFC tracer and soil gas anomalies. The integrated studies were designed to help optimize estimation of CO2 escape volume if leakage were to occur. Collaborative efforts were also designed to compliment and enhance the ongoing efforts of the Southwest Regional Partnership (SWP). Site characterization activities included field and satellite based fracture mapping, subsurface mapping of the region using geophysical logs, evaluation of interferrometric synthetic aperture radar (InSAR) observations to accurately measure ground movements at the site, detailed electromagnetic surveys, lineament analysis of radar and Landsat imagery and 3D seismic interpretation (see locations in Figures 1 and 2). Additional discussion of these efforts can be found in Wilson et al. (2008 and 2009). In support of the present study WVU and NETL initiated and funded logging operations of the ConocoPhillips EPNG COM A ING 1 injection well, helped plan and design the VSP time-lapse surveys and set up a separate contract with Schlumberger to fund additional time-lapse processing of the VSP data. Initial time lapse processing was completed in November of 2009. Significant differences in the acoustic properties of the Fruitland sequence attributable to CO2 injection have not been detected. Additional time-lapse processing is still underway. Source point locations Figure 1 3D arbitrary line through offsets B and C through the injection well A) Regional location map and B) structure on the base of the Fruitland Formation. Offset B - baseline Offset C - baseline ConocoPhillips EPNG COM A ING 1 CO2 Injection Well SWP Pre-Injection Vertical Seismic Profiles 3D arbitrary line through the injection well and offset D A. B. Offset D - baseline Comparisons of the baseline (pre-injection) VSPs to bandpass filtered arbitrary lines extracted from 3D seismic that extend through the injection well and VSP source points (B, C and D) (see line location map Figure 3). The VSP data were collected for the Southwest Regional Partnership and processed by Schlumberger. (VSP displays, courtesy of Schlumberger, 2008). Acquisition and Processing Comments The baseline and monitor VSP surveys (Figure 4, right ) were collected using a 12 second duration Vibroseis upsweep from 8-120 Hz. Differences between baseline and monitor surveys often arise for a variety of reasons. In the present case, for example, heavy rains preceded the monitor survey while the initial baseline survey was conducted under dry conditions. Other differences between the baseline and monitor survey unrelated to CO2 injection include repositioning of the source at offset B (see Figure 3) to reduce distortion levels during the monitor survey, skipped shots during the baseline survey and differences in receiver depths in the recording well noted in the monitor survey. Offset VSP processing steps included true amplitude recovery, bandpass filtering (3 – 120 Hz.), amplitude normalization, median velocity filtering to separate downgoing and upgoing wavefields and waveshape deconvolution. Processing of the baseline and monitor data sets were identical. The differenced data sets (monitor – baseline) retain considerable amplitude at all recording times but the differences are especially noticeable for Offset D (Figure 5, see panel 2 right). Additional processing included crossequalization (e.g. Ross et al., 1996) and non-rigid matching (Nickel and Sonneland, 1999). Refinements to the VSP processing workflow continue to be tested. C. D. Figure 3 Figure 4 Sensors for the VSP survey were placed in the ConocoPhillips EPNG COM A ING1 CO2 injection well (Figure 3A). The relative locations of the source points A-D are shown along with surrounding production wells in Figure 3B. The Fruitland sequence is highlighted in a seismic line from the 3D survey (C). The internal reflection response is complex and reflection discontinuity common. An isopach of the Fruitland sequence (D) reveals considerable variation in travel time through the Fruitland reservoir interval. Source offsets B and C lie along a northeast-southwest line (~N30E). Some relative time-shift between the 3D seismic and offset VSP event times was introduced to align interpreted event correlations and arrival times. Common midpoint locations in the VSP displays increase in offset from right to left for Offset B and from left to right for offsets C and D. Midpoints extend at most to approximately half the distance between the injection well in which the geophones were placed and individual source point locations.
Pre- and Post-injection Vertical Seismic Profiling over the Southwest Regional Partnership’s Phase II Fruitland Coal CO2 Pilot Panel 2 Tom Wilson1,2, Les Nutt3, Ric Smith3, Jitendra Gulati3, Marcia Coueslan3, Dwight Peters3, Art Wells2, Craig Hartline4, George Koperna5 and Bill Akwari4 1 West Virginia University, 2 National Energy Technology Laboratory, 3 Schlumberger, 4 ConocoPhillips, 5 Advanced Resources International AAPG Rocky Mountain Section Meeting in Durango, Colorado, June 13-16, 2010 Time lapse comparison of monitor and baseline surveys CMP differences (Run 2- Run 1 or monitor – baseline) are shown for offset VSPs B, C and D (Figure 5A). These represent output from the initial stage of processing. Significant amplitude response is observed throughout the differenced records. The differences are more noticeable for Offset D, particularly for the Fruitland and deeper events. The synthetic response (Figure 6C, below) indicates arrival times of approximately 0.55 seconds for the upper Fruitland. Additional processing incorporated migration and conversion to depth along with crossequalization and non-rigid matching (Figure 5B). Crossequalization is defined by Ross et al. (1996) as a combination of matched filtering, amplitude scaling and static correction that produces a match between the baseline and monitor responses. The process is usually designed on data above the zone of interest in portions of the data unlikely to have been affected by production or injection. When applied in this fashion, the process eliminates significant difference in areas above the reservoir. Differences remaining within the reservoir and below can then be interpreted to result from possible change of acoustic properties of the reservoir. Non-rigid matching (Nickel and Sonneland, 1999) is another approach with similar objective. This process is also generally designed on data above the reservoir. It assumes that samples (voxels) in the monitor survey are displaced versions of those in the initial survey. Samples in the monitor data set are relocated to improve the match and the relocated data form a reference survey that is subtracted from the baseline survey to provide a time-lapse view in which differences may be restricted to reservoir effects. Results presented for crossequalization and non-rigid matching (Figure 5B) were designed on the entire data set. This represents a global design approach. Global design, in this case, effectively removed any indications of change attributable to differences of acoustic properties in the reservoir and deeper intervals for offsets B and D. Differences observed in Offset C are difficult to interpret. A band of relatively high amplitude differences is observed around depths of 2700 feet (approximately 250 feet above the upper Fruitland Coal) and in depths beneath the reservoir (>3200 feet). The differences show no clear relationship to changes of acoustic properties within the reservoir. baseline monitor Baseline - monitor Case 1 0’ 3000’ Velocity in coal section increased 10% Case 1 Post Injection travel time advance A. Difference - B Difference - C Difference - D monitor Baseline - monitor baseline 0’ 3000’ Case 2 Velocity of individual coals decreased by 10% Case 2 Post Injection travel time delay B. Figure 7 Figure 5 Comparisons of synthetic baseline and monitor CMP gathers (Figure 7) showing time lapse responses for two cases: 1) increased velocity in the coal section and 2) decreased velocity within individual seams. Close up views of the Fruitland coal section highlight differences observed for each case. AVO plots are presented for both cases. The CMP gathers are used as a proxy for the VSP response: the response at longer CMP offsets corresponds to deeper phones in the borehole VSP. For either case the time lapse response results primarily from relative traveltime delay or advance. What could we expect to see in the time-lapse VSP response? Some published studies suggest that acoustic impedance of coal will be increased by CO2 injection due to preferential adsorption CO2 molecules and coal swelling. Xue and Ohsumi (2005), for example, make detailed measurements of swelling strain and waveform traveltime changes for the Kushiro Coal in Hokkaido, Japan. They note a 10% increase in P-wave velocity at 2.5 MPa (~362psi) and perhaps up to 12.7% at 12 MPa (supercritical). Nishimoto et al. (2008) report only 2.2% increase in Vp at 12MPa under supercritical conditions. McCrank (2009) notes that CO2 injection into the Ardley Coal, Alberta, produces a 10% reduction in velocity attributed to increased coal plasticity after a 9 month CO2 soak. In the following section (see figures 6 and 7) we calculate AVO variations in CMP gathers using full solutions of the Zoepritz equations. CMP gathers in this case are used as a proxy for the VSP response. In the gathers, short to long offsets correspond roughly to upper to lower borehole sensor locations. Two possible scenarios are modeled: 1) CO2 injection reduces coal velocity and 2) CO2 injection increases coal velocity. The results suggest that in both cases significant time lapse response occurs due to relative delay or advance in the pre-to-post injection traveltimes. The accompanying model studies evaluate potential AVO and time lapse response to CO2 injection; present simulations for alternative cases in which CO2 increases and decreases coal zone velocity; and, determine the potential for time lapse AVO observations in CMP and VSP records. Conclusions At present, results of time-lapse processing suggest that differences between the monitor and baseline surveys are minimal and do not reveal any significant change in the acoustic properties of the reservoir during the 1.3 year interval between the two surveys. Although injection proceeded for 1 year with total injection volume of 319MMCF, the injection well was allowed to pressure down for one month preceding the VSP monitor survey. The volume of CO2 released during the pressure down period may have significantly reduced the impact of residual CO2 on the acoustic properties of the reservoir. The reasonable expectation in this case may be that significant differences in the acoustic properties of the reservoir should be minimal and perhaps unobservable. However, as noted earlier, the crossequalization and non-rigid matching processes presented here incorporated a global design approach which tends to eliminate all differences between the baseline and monitor data sets. At present, we await results in which the crossequalization and non-rigid matching operations are designed on data from above the reservoir. There are inherent errors in either the global or local design approach. The potential for success using local design in the window of data above the reservoir is limited due to a lack of good signal-to-noise ratio and a lack of coherent reflection events in the window of data overlying the Fruitland. The results of reprocessing may continue to suggest that CO2 induced change is not observable. This outcome would most likely be due to extensive pressure draw-down following injection. In this study, we also modeled differences we might expect to see from CO2 injection. Time lapse differences in two CMP attributes were evaluated: 1) AVO, and 2) travel time delay or advance. Travel time delay or advance is a discriminating attribute whereas the difference in AVO is not. The simulations suggest that differentiation between faster or slower effect may be detected in CMP gathers or VSP surveys through cross-equalization of the seismic response above the injection zone followed by careful analysis of travel time differences between events in the baseline and monitor surveys arising from within and beneath the injection zone. • References • Henthorn, B., Wilson, T., and Wells, A., 2007, Subsurface Characterization of a Carbon Sequestration Pilot Site: San Juan Basin, NM: Annual AAPG Convention, Proceedings CD. See also http://www.searchanddiscovery.net/documents/2007/07047henthorn /index.htm & http://www.geo.wvu.edu/~wilson/netl/ HenthornWilson&Wells -07AAPG.pdf • McCrank, M., 2009, Seismic detection and characterization of a CO2 flood in Ardley Coals, Alberta, Canada: M. S. Thesis, Department of Geoscience, Calgary, Alberta, 191p. • Nickel, M., and Sonneland, L., 1999, rigid matching of migrated time-lapse seismic: SEG expanded Abstracts, 4p. • Nishimoto, S., et al., 2007, Experimental study of coal matrix swelling and gas permeability during adsorption of supercritical CO2: Japan Geoscience Union Meeting Abstract, http://wwwsoc.nii.ac.jp/jepsjmo/cd-rom/2007cd-rom/program/pdf/J253/J253-P015_e.pdf • Ross, C., Cunningham, G., and Weber, D., 1996, Inside the crossequalization black box: The Leading Edge, vol. 15, no. 11, p. 1233-1240. • Wilson, T., Wells, A., Rauch, H., Strazisar, B., and Diehl, R., 2008, Site Characterization Activities with a focus on NETL MMV efforts: Southwest Regional Partnership, San Juan Basin Pilot, New Mexico: Proceedings 2008 International Pittsburgh Coal Conference, Sept. 29 to Oct. 2, 16 pages. • Wilson, T., Art Wells and George Koperna, 2009, Seismic Evaluation of the Fruitland Formation with Implications on Leakage Potential of Injected CO2: Proceedings 2009 International Pittsburgh Coal Conference, Pittsburgh, PA, USA September 21 – 24, 11p. • Xue, Z., and Ohsumi, T., 2005, Experimental studies on coal matrix swelling due to carbon dioxide adsorption and its effect on coal permeability: Shigen-to-Sozai, vol 121, no.6, p. 231-239 (in Japanese with English abstract and figure captions). • Xue, Z., and Ohsumi, T., 2003, Laboratory measurements on swelling in coals caused by adsorption of carbon dioxide and its impact on permeability of coal: Coal & Safety, no. 23, p 36-43. Zero offset VSP used as TD curve to adjust sonic sonic and density travel time data used to generate AVO synthetics. A. Original and modified logs for the fast model. Synthetic AVO response computed for the fast case. Acknowledgements This technical effort was performed in support of the National Energy Technology Laboratory’s on-going research in carbon sequestration under the RDS contract DE-AC26-04NT41817-6060404000 and URS subcontract No. 2010-SC-RES-30033-023. We’d like to thank Dave Wildman and Donald Martello, our DOE-NETL project managers, for their support and advice on these efforts; Scott Reeves and Brian McPherson of the Southwest Regional Partnership for their help in facilitating our involvement in the Partnership’s activities on their San Juan Basin carbon sequestration pilot test and for allowing us to use data collected as part of the pilot effort; and Ryan Frost and Tom Cochrane of Conoco Phillips for helping facilitate many of the activities on the site. We also want to thank Bill O’Doud (NETL) SWP project manager. Landmark Graphics LogM software was used to compute synthetic AVO responses. Seismic Micro-Technology’s Kingdom Suite was used to interpret the 3D seismic data over the site. B. C. Figure 6
The Kirtland Shale primary seal (caprock) Fruitland Formation reservoir zone Pre- and Post-injection Vertical Seismic Profiling over the Southwest Regional Partnership’s Phase II Fruitland Coal CO2 Pilot Objective A variety of characterization activities have been undertaken on the Southwest Regional Carbon Sequestration Partnership’s San Juan Basin pilot site to aid in the deployment and subsequent interpretation of the National Energy Technology Laboratory’s MMV tracer and soil gas monitoring efforts. Approximately 18,000 tons of CO were injected into the Fruitland Coals from . Site characterization activities included field and satellite based fracture mapping, subsurface mapping of the region using geophysical logs, evaluation of interferrometric synthetic aperture radar (INSAR) measurements of ground movements at the site, detailed electromagnetic surveys, lineament analysis of radar and Landsat imagery, design of a near-surface ground water monitoring well program and the design of detailed logging and time-lapse vertical seismic profiling (VSP). This poster provides some recent results from the ongoing analysis of the time-lapse VSP. Heterogeneity in the reservoir and sealing strata QuickBird fracture trace orientations along the west (left) and southeast (right) canyons near the new injection well. Surface fracture trace orientations along the west (left) and southeast (right) canyons near the new injection well. Terrain conductivity response, PFC tracer and soil gas sampling locations Conclusions As part of the NETL-University Consortium we initiated several site characterization activities with the objective of providing feedback to the NETL MMV team regarding locations of possible CO2 leakage pathways and the optimal placement of monitoring technologies to optimize estimation of CO2 escape volume if leakage were to occur. Collaborative efforts were also designed to compliment and enhance ongoing Partnership efforts. The work discussed in this paper concentrates on collaborative efforts conducted at the Southwest Regional Partnership’s San Juan Basin pilot. Terrain conductivity surveys reveal interconnected low conductivity anomalies in well drained areas within the massive sand that underlies the site. These low conductivity zones may facilitate groundwater flow and migration of CO2 to the surface if leakage occurs. Based on the results of the terrain conductivity surveys, recommendations were made to undertake additional tracer and soil gas sampling in these areas. Log data through the intermediate zone (top of the Fruitland to near-surface) provide detailed observations of P-wave and S-wave transit times, density, shear-wave anisotropy and mechanical properties through 2600 feet of the strata overlying the injection zone. A synthetic seismogram compiled from the density and sonic logs provides a preliminary simulation of the subsurface seismic reflection response and serves as the basis for a preliminary interpretation of events observed in the zero-offset vertical seismic profile (VSP). Future VSP interpretations and modeling may provide additional insights into the potential for CO2 escape through the intermediate zone. The planned time-lapse imaging may also reveal the position of the CO2 flood front within the Fruitland coal interval. The research undertaken in this project helps 1) identify potential leakage zones and 2) suggests additional locations for NETL monitoring activities. As a contributing partner in the regional partnership efforts our activities help expand outgrowths of partnership monitoring efforts by enhancing the monitoring and modeling efforts conducted both by NETL and the partnerships at individual pilot sites. A. B. C. D. F. E. Arbitrary lines in the 3D survey (A) extend through the injection well and source point D (B), source points B and C (D) and along an ~EW line extending through the FCS COM 001 production well (E). The arbitrary lines were processed to enhance discontinuity in the seismic. Stratigraphic pinchout in the underlying Pictured Cliffs (e.g. Figure D) may be associated with a shoreline sand body. The feature forms a local high that extends NW through the injection well for a distance of about 3 km (C). The Fruitland sequence is thinned over this feature perhaps as a result of differential compaction. A variety of local reflection discontinuities observed in the processed seismic (B, D, E) suggest that the Fruitland and overlying Kirtland Shale (the primary seal for the Fruitland) may be locally faulted. The seismic view reveals significant local structural and stratigraphic complexity that could adversely influence long term CO2 retention. SWP Vertical Seismic Profile Acknowledgements This technical effort was performed in support of the National Energy Technology Laboratory’s on-going research in carbon sequestration under the RDS contract DE-AC26-04NT41817-6060404000. We’d like to thank Dave Wildman and Donald Martello, our DOE-NETL project managers, for their support and advice on these efforts; Scott Reeves and Brian McPherson of the Southwest Regional Partnership for their help in facilitating our involvement in the Partnership’s activities on their San Juan Basin carbon sequestration pilot test and for allowing us to use data collected as part of the pilot effort; and Ryan Frost and Tom Cochrane of Conoco Phillips for helping facilitate many of the activities on the site. Appreciation is also extended to Dwight Peters and Marcia Coueslan with Schlumberger for critical assistance in the design of the logging and VSP acquisition, analysis and processing efforts at the site. We also want to thank Bill O’Doud (NETL) for his review comments. • References • Henthorn, B., Wilson, T., and Wells, A., 2007, Subsurface Characterization of a Carbon Sequestration Pilot Site: San Juan Basin, NM: Annual AAPG Convention, Proceedings CD. See also http://www.searchanddiscovery.net/documents/2007/07047henthorn /index.htm & http://www.geo.wvu.edu/~wilson/netl/ HenthornWilson&Wells -07AAPG.pdf • MDA Geospatial Services, 2007, Evaluation of InSAR technology for monitoring ground movement in New Mexico: report prepared for Tom Wilson, June 18, 2007, 23p. • Schlumberger, 2008, Sonic Scanner borehole anisotropy analysis – EPNG COM A ING 1. • Schlumberger, 2008, Vertical seismic profile – EPNG COM A ING 1 well, Z-axis processing and display.