Download
1 / 24
240 likes | 491 Views
Gene Expression And Regulation. Bioinformatics January 11, 2006 D. A. McClellan (david_mcclellan@byu.edu). Gene Expression. Expressed in the transcriptome Every eukaryotic genome contains between 5000-60,000 protein-coding genes Only a small subset of those genes are transcribed.

E N D
Gene Expression And Regulation Bioinformatics January 11, 2006 D. A. McClellan (david_mcclellan@byu.edu)
Gene Expression • Expressed in the transcriptome • Every eukaryotic genome contains between 5000-60,000 protein-coding genes • Only a small subset of those genes are transcribed
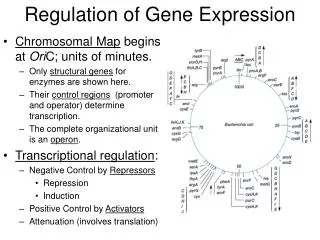
Gene expression is regulated in several basic ways • • by region (e.g. brain versus kidney) • • in development (e.g. fetal versus adult tissue) • • in dynamicresponse to environmental signals • (e.g. immediate-early response genes) • in disease states • by gene activity Page 157
Central Dogma of Molecular Biology DNA RNA protein phenotype cDNA Page 159
protein protein DNA RNA DNA RNA cDNA cDNA UniGene SAGE microarray Fig. 6.2 Page 159
Expression Databases & Analyses • UniGene: for the comparison of cDNA libraries • Goals: (1) create one unique entry for each gene, (2) collect all the ESTs associated with each gene • SAGE: Serial Analysis of Gene Expression library • DNA microarrays
5’ 3’ exon 1 intron exon 2 intron exon 3 3’ 5’ transcription 5’ 3’ RNA splicing (remove introns) 3’ 5’ polyadenylation 5’ AAAAA 3’ Export to cytoplasm Fig. 6.3 Page 161
Relationship of mRNA to genomic DNA for RBP4 Fig. 6.4 Page 162
Analysis of gene expression in cDNA libraries • A fundamental approach to studying gene expression • is through cDNA libraries. • Isolate RNA (always from a specific • organism, region, and time point) • Convert RNA to complementary DNA • Subclone into a vector • Sequence the cDNA inserts. • These are Expressed Sequence Tags insert vector Page 162-163
UniGene: unique genes via ESTs • • Find UniGene at NCBI: • www.ncbi.nlm.nih.gov/UniGene • UniGene clusters contain many ESTs • • UniGene data come from many cDNA libraries. • Thus, when you look up a gene in UniGene • you get information on its abundance • and its regional distribution. Page 164
Cluster sizes in UniGene This is a gene with 1 EST associated; the cluster size is 1 Page 164 & Fig. 2.3, Page 23
Cluster sizes in UniGene This is a gene with 10 ESTs associated; the cluster size is 10 Page 164
Cluster sizes in UniGene (human) Cluster size Number of clusters 1 10,400 2 7,100 3-4 6,800 5-8 5,300 9-16 3,800 17-32 3,100 500-1000 1,500 2000-4000 130 8000-16,000 12 16,000-30,000 3 Page 164 UniGene build 186, 9/05
Ten largest human UniGene clusters Cluster size Gene 22,925 eukary. translation EF (Hs. 522463) 22,320 eukary. translation EF (Hs. 4395522) 16,562 actin, gamma 1 (Hs.514581) 16,309 GAPDH (Hs.169476) 16,231 actin, beta (Hs.520640) 11,076 ribosomal prot. L3 (Hs.119598) 10,517 dehydrin (Hs.524390) 10,087 enolase 1 (alpha)(Hs.517145) 9,973 ferritin (Hs.433670) 8,966 metastasis associated (Hs.187199) Table 6.2 Page 165 UniGene build 186, 9/05
UniGene brain libraries
UniGene lung libraries
Fig. 6.7 Page 167
Brain Lung Fig. 6.7 Page 167
CamKII up-regulated in brain n-sec1 up-regulated in brain surfactant up- regulated in lung Page 167
Fisher’s exact test provides a p value Digital differential display (DDD) results in UniGene are assessed for significance using Fisher’s exact test to generate a p value. p = The null hypothesis (that gene 1 is not differentially regulated in a comparison of two libraries) is rejected when p is < 0.05/G (where G = the number of UniGene clusters analyzed). NA! NB! c! C! (NA + NB)! g1A! g1B! (NA – g1A)!(NB – g1B)! Pages 165
Pitfalls in interpreting cDNA library data • • bias in library construction • • variable depth of sequencing • • library normalization • error rate in sequencing • contamination (chimeric sequences) Pages 166-168
http://mgc.nci.nih.gov Fig. 6.8 p. 168-169
Serial analysis of gene expression (SAGE) • 9 to 11 base “tags” correspond to genes • measure of gene expression in different biological samples • SAGE tags can be compared electronically Page 169
SAGE tags are mapped to UniGene clusters Cluster 1 Cluster 2 Cluster 3 Tag 1 Tag 1 Tag 2 Tag n Cluster 1 Page 169