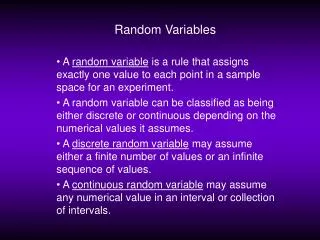
Random Variables
Discrete Random Variables: a random variable that can assume only a countable number of values. The value of a discrete random variable comes from counting. Continuous Random Variable:

Random Variables
E N D
Presentation Transcript
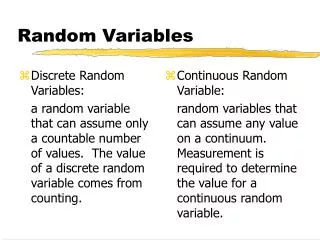
Discrete Random Variables: a random variable that can assume only a countable number of values. The value of a discrete random variable comes from counting. Continuous Random Variable: random variables that can assume any value on a continuum. Measurement is required to determine the value for a continuous random variable. Random Variables
Continuous Probability Distributions The probability distribution of a continuous random variable is represented by a probability density function that defines a curve. The area under the curve corresponds to the probabilities for the random variable.
Continuous Probability Distributions • The Continuous Uniform Distribution • A probability distribution in which the probability of a value occurring between two points, a and b, is the same as the probability between any other two points, c and d, given that the distance between a and b is equal to the distance between c and d. f (x) = 1 / ( b - a ) if a< x <b
The Uniform Probability Density Function • Mean and standard deviation of the uniform probability density function:
EXAMPLE Suppose the research department of a steel manufacturer believes that one of the company’s rolling machines is producing sheets of steel of varying thickness. The thickness is a uniform random variable with values between 150 and 200 millimeters. Any sheet less than 160 millimeters must be scrapped because they are unacceptable to buyers.
EXAMPLE • Calculate the mean and standard deviation of x, the thickness of the sheets produced by this machine. Then graph the probability distribution and show the mean on the horizontal axis. • Calculate the fraction of steel sheets produced by this machine that have to be scrapped.
Continuous Probability Distributions • The Normal Distribution • A bell-shaped, continuous distribution with the following properties: • It is unimodal; the normal distribution peaks at a single value. • It is symmetrical; 50% of the area under the curve lies left of the center and 50% lies right of the center. • The mean, mode, and median are equal. • It is asymptotic; the normal distribution approaches the horizontal axis on each side of the mean toward +
The Normal Distribution The Normal Distribution is defined by two parameters:
The Standard Normal Distribution The Standard Normal Distribution is a continuous, symmetrical, bell-shaped distribution that has a mean of 0 and a standard deviation of 1.
The Z Score The Z Score is the number of standard deviations between the mean and the point X.