Understanding Veneto GAS: Consumer Demographics, Volunteer Engagement, and Economic Impact
This report examines the Veneto GAS (Gruppi d’Acquisto Solidale), serving a potential consumer base of 21,000 individuals and families, with an average of 2.4 people per family. It reveals significant volunteer engagement, with 2,210 volunteers, averaging 14.6 per GAS, alongside insights into financial management, public funding relations, and supply chain dynamics. Additionally, the study explores shopping frequency and its economic implications, finding that weekly participation could boost total consumer spending to 7.5 million euros, revealing a strong profitability rate compared to traditional markets.


Understanding Veneto GAS: Consumer Demographics, Volunteer Engagement, and Economic Impact
E N D
Presentation Transcript
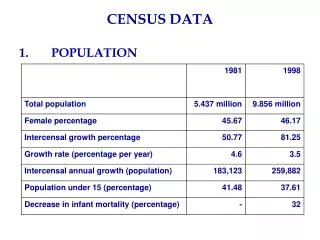
3 . MEMBERS AND CONSUMERS Veneto GAS reach a potential population of 21.000 “consumers” *) Data includes individuals and families. Families are broken up according to the national average data of 2,4 people per family
4 . THE VOLUNTEERS Total Number of Volunteers: 2210 Averager Number of Volunteers per GAS: 14.6 Average Number of Active Volunteers in the cultural, sports and social associations in the Venice Municipality: 11.6
5 . STATUTE AND CHARTER GAS having a statute: 46% GAS enrolled in the APS charter: 6%
6 . FINANCIAL MANAGEMENT 17.5% of GAS have a bank account The census of Social Currencies Projects has not been conducted
8 . RELATIONS WITH THE PUBLIC ADMINISTRATION In the French region Rhône-Alpes, 75% of the operational costs of GAS are covered by public funding
9 . RELATIONS WITH OTHER ASSOCIATIONS Only 20% of GAS have no relation with other associations.
10 . RELATIONS WITH SUPPLIERS 9 out of 10 GAS carry out activities with the suppliers
11 . THE SHOPPING / 1 93.75% declare that since the establishment date the number of products sold has increased. The rest declare that the basket has held stable
12 . THE SHOPPING / 2 With the current shopping frequency, the total shopping for the Veneto GAS equals 5 million euro If the shopping be made by all the groups once a week, the figure would rise to 7.5 million euro
13 . SUPPLIERS Average number of suppliers per GAS: 10.7
14 . CRITICAL SITUATIONS FACED BY GAS volunteers recruitment: 32% seat: 23% relation with institutions: 18.3% lack of members: 7.6% difficulties with DES: 6.4% small basket: 6.4% lack of funding: 3.8% difficulties with the suppliers 2.5%
TOWARDS THE PERMANENT MONITORING 15 . PRICES: GAS vs TRADITIONAL MARKET
16 . DISTRIBUTION SYSTEM COSTS: GAS vs TRADITIONAL MARKET
17 . PROFITABILITY RATING HOW MUCH IS A GAS EURO WORTH ? From an analysis of the products distribution within the basket, it was calculated that one Euro spent at Venice-based GAS guarantees to producers an average profitability which is 4.3 times above the traditional market