
Agenda
Agenda. Informationer Supplerende litteratur ”Pitch-dag” den 4/3 Skalaer Bedst På Nettet skema Deskriptiv statistik Teori Små øvelser i Excel Dagens øvelser Skalaer Pitch-tale. Spørgeskema fra www.bedstpaanettet.dk. Eksempler på skalaer. Spørgsmål:

Agenda
E N D
Presentation Transcript
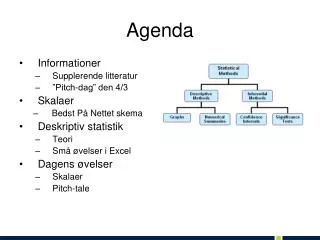
Agenda • Informationer • Supplerende litteratur • ”Pitch-dag” den 4/3 • Skalaer • Bedst På Nettet skema • Deskriptiv statistik • Teori • Små øvelser i Excel • Dagens øvelser • Skalaer • Pitch-tale
Eksempler på skalaer Spørgsmål: Hjemmesiden giver alt i alt et positivt helhedsindtryk Mulige skalaer:
Udformning af skalaer Valg ved udformning af skalaer skal der vælges … Antal svarkategorier (2, 3, 4, 5, 6, 7, ...) Lige eller ulige antal svarkategorier (= skal der være en midterkategori?) Navne / symboler på svarkategorier Rækkefølge (”positiv” først eller sidst) Scoring af svarkategorier, f.eks. 5 = meget tilfreds og 1 = meget utilfreds
Validitet • Validitet • Validitet, (af lat. validitas 'styrke'), gyldighed, korrekthed, sandhed. Inden for de empiriske videnskaber stilles krav om en målings validitet, dvs. at der måles det, man har til hensigt at måle. Kilde: Den Store Danske Encyklopædi. Det vi har til hensigt at måle Det vi faktisk måler
Stress Angst Bekymring Kompetencekrav Kontrol Flow zone Afslapning Kedsomhed Kompetencer Operationalisering Def.: Flow er en tilstand, hvor man udnytter sine evner fuldt ud og er så opslugt af sine opgaver, at man glemmer tid og sted. Tilstanden bevirker stærke positive følelser, hvilket er kroppens belønning for, at man udnytter sine evner fuldt ud. (Professor Mihaly Csikszentmihalyi). I flow tilstanden er man maksimalt engageret og man udnytter sine kompetencer maksimalt. 1.1 Jeg ved hvad der forventes af mig på kurset. 1.2 Jeg føler mig fagligt "klædt på" til at løse opgaverne. 1.3 Jeg har tilstrækkeligt med faglige udfordringer. 1.4 Jeg har mulighed for at lære nyt. 1.5 Jeg har indflydelse på tilrette-læggelsen af mine opgaver. 1.6 Jeg har gode fysiske rammer for at løse mine opgaver (plads, lokaler, redskaber osv).
Exploring Data with Graphs and Numerical Summaries • Calculating the mean • Calculating the median • Comparing the Mean & Median • Definition of Resistant
Mean (gennemsnittet) • The mean is the sum of the observations divided by the number of observations • n betegner antallet af observationer (=stikprøvestørrelsen) • y1, y2, y3, … yi ,..., yn betegner de n observationer • betegner gennemsnittet • It is the center of mass. Do it in Excel
Median • The median is the midpoint of the observations when they are ordered from the smallest to the largest (or from the largest to smallest) • Order observations • If the number of observations is: • Odd, then the median is the middle observation • Even, then the median is the average of the two middle observations
Median 1) Sort observations by size, n = number of observations ______________________________ 2,a) If n is odd, the median is observation (n+1)/2 down the list n = 9 (n+1)/2 = 10/2 = 5 Median = 99 2,b) If n is even, the median is the mean of the two middle observations n = 10 (n+1)/2 = 5,5 Median = (99+101) /2 = 100
Comparing the Mean and Median • The mean and median of a symmetric distribution are close together, • For symmetric distributions, the mean is typically preferred because it takes the values of all observations into account
Comparing the Mean and Median • In a skewed distribution, the mean is farther out in the long tail than is the median • For skewed distributions the median is preferred because it is better representative of a typical observation
Resistant Measures • A numerical summary measure is resistant if extreme observations (outliers) have little, if any, influence on its value • The Median is resistant to outliers • The Mean is not resistant to outliers • Hvis I kun kan få én oplysning om løn-niveauet i en virksomhed med 4 ansatte, vil I så have gennemsnit eller median?
Exploring Data with Graphs and Numerical Summaries • Calculate the range (variationsbredden) • Calculate the standard deviation • Know the properties of the standard deviation, s • Know how to interpret the standard deviation, s: The Empirical Rule
Range • One way to measure the spread is to calculate the range. The range is the difference between the largest and smallest values in the data set; Range = max min • The range is strongly affected by outliers
Standard Deviation • Find the mean • Find the deviation of each value from the mean • Square the deviations • Sum the squared deviations • Divide the sum by n-1
Standard Deviation Gives a measure of variation by summarizing the deviations of each observation from the mean and calculating an adjusted averageof these deviations.
Properties of the Standard Deviation • s measures the spread of the data • s = 0 only when all observations have the same value, otherwise s > 0, As the spread of the data increases, s gets larger, • s has the same units of measurement as the original observations. The variance=s2 has units that are squared. • s is not resistant. Strong skewness or a few outliers can greatly increase s.
Exploring Data with Graphs and Numerical Summaries • Obtaining quartiles and the 5 number summary • Calculating interquartile range and detecting potential outliers • Drawing boxplots • Comparing Distributions
Percentile • The pth percentile is a value such that p percent of the observations fall below or at that value
Finding Quartiles • Splits the data into four parts • Arrange the data in order • The median is the second quartile, Q2 • The first quartile, Q1, is the median of the lower half of the observations • The third quartile, Q3, is the median of the upper half of the observations
Measure of spread: quartiles Quartiles divide a ranked data set into four equal parts. The first quartile, Q1, is the value in the sample that has 25% of the data at or below it and 75% above The second quartile is the same as the median of a data set, 50% of the obs are above the median and 50% are below The third quartile, Q3, is the value in the sample that has 75% of the data at or below it and 25% above Q1= first quartile = 2,2 M = median = 3,4 Q3= third quartile = 4,35
Quartile Example Find the first and third quartiles Number of downloaded apps the last 10 days: 2 4 11 13 14 15 31 32 34 47 What is the correct answer? • Q1 = 2 Q3 = 47 • Q1 = 12 Q3 = 31 • Q1 = 11 Q3 = 32 • Q1 =12 Q3 = 33
Calculating Interquartile range • The interquartile range is the distance between the third quartile and first quartile: • IQR = Q3 Q1 • IQRgives spread of middle 50% of the data
5 Number Summary • The five-number summary of a dataset consists of the • Minimum value • First Quartile • Median • Third Quartile • Maximum value
Criteria for identifying an outlier • An observation is a potential outlier if it falls more than 1,5 x IQR below the first quartile or more than 1,5 x IQR above the third quartile
Exploring Data with Graphs and Numerical Summaries • Distribution • Graphs for categorical data. Overvej: • Søjle diagram • Lagkage diagram • Graphs for quantitative data. Overvej : • Box-plot • Sum kurve
Boxplot • A box goes from the Q1 to Q3 • A line is drawn inside the box at the median • A line goes from the lower end of the box to the smallest observation that is not a potential outlier and from the upper end of the box to the largest observation that is not a potential outlier • The potential outliers are shown separately
Comparing Distributions Box Plots are useful for making graphical comparisons of two or more distributions
Agenda • Informationer • Supplerende litteratur • ”Pitch-dag” den 4/3 • Skalaer • Bedst På Nettet skema • Deskriptiv statistik • Teori • Små øvelser i Excel • Dagens øvelser • Pitch • Skalaer • Deskriptiv analyse


