
Investigating Temporal Aggregation Effects on ITS Data Reliability and Delay Estimation
This study examines the impact of temporal aggregation on Intelligent Transportation System (ITS) data, particularly focusing on traffic speed and delay estimations. Raw data is typically aggregated into intervals of 20-30 seconds for communication and further into 1-60 minute intervals for archiving. By analyzing shockwave speeds at a freeway bottleneck using both disaggregated and aggregated data, we demonstrate that larger aggregation intervals lead to significant errors in traffic measures. Our findings underscore the importance of maintaining high time resolution for accurate travel time and delay estimates.

Investigating Temporal Aggregation Effects on ITS Data Reliability and Delay Estimation
E N D
Presentation Transcript
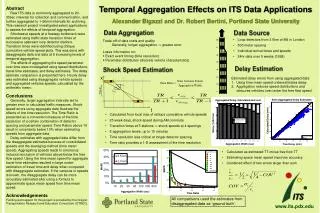
Temporal Aggregation Effects on ITS Data Applications Alexander Bigazzi and Dr. Robert Bertini, Portland State University Abstract Raw ITS data is commonly aggregated to 20-30sec intervals for collection and communication, and further aggregated to 1-60min intervals for archiving. This research project investigated select applications to assess the effects of temporal aggregation. Shockwave speeds at a freeway bottleneck were estimated using traffic state transition times at successive upstream loop detector stations. Transition times were identified using oblique cumulative vehicle-speed plots. This was done with disaggregate data and data at 8 increasing levels of temporal aggregation. The effects of aggregating the speed parameter over time were investigated using speed distributions, travel time estimates, and delay estimates. The delay estimate comparison is presented here. Hourly delay was estimated using disaggregate vehicle speeds and aggregated vehicles speeds, calculated by the arithmetic mean. Conclusions Generally, larger aggregation intervals led to greater error in calculated traffic measures. Shock speed errors using aggregate data illustrate the effects of low time resolution. The Time Ratio is presented as a convenient measure of the time resolution of a certain combination of detector spacing and parameter speed. Time Ratios above 10 result in uncertainty below 10% when estimating speeds from aggregate data. Delay estimates with aggregated data differ from the disaggregate estimates because of consolidated speeds and the averaging method (time mean speed). Aggregating speeds leads to erroneous inclusion/exclusion of vehicles above/below the free flow speed. Using the time mean speed for aggregate travel time estimates resulted in large under-estimation of travel time and delay when compared with disaggregate estimates. If the variance in speeds is known, the disaggregate delay can be more accurately estimated after using a formula to approximate space mean speed from time mean speed. Acknowledgements Funding and support for this project is provided by the Oregon Transportation Research and Education Consortium (OTREC). x Empirical Comparison of German and U.S. Traffic Sensor Data and Impact on Driver Assistance Systems Steven Hansen and Dr. Robert L. Bertini, Portland State University Data Aggregation Data Source vmax Travel • Loop detectors from 3.5km of M4 in London • 500 meter spacing • Individual arrival times and speeds • 24hr data over 5 weeks (1998) vmin Trade-off of data costs and quality Generally, longer aggregation -> greater error • Loses information on: • Exact event timing (time resolution) • Parameter distribution (discrete vehicle characteristics) t Delay Estimation Shock Speed Estimation Estimated delay errors from using aggregated data: Using time mean speed underestimates delay Aggregation reduces speed distributions and obscures vehicles over/under the free flow speed Steve Hansen, Dr. Robert Bertini, Portland State University 5min Aggregated Delay Estimates Aggregated Delay, Calculated and Lost • Calculated from local max of oblique cumulative vehicle speeds • 25 week days, shock speed during AM commute • Transition times at 5 stations -> shock speeds at 4 spacings • 8 aggregation levels, up to 15 minutes • Time resolution less critical at longer detector spacing • Time ratio provides a 1-D assessment of the time resolution Calculated Delay (min) Delay (1,000 hrs) Aggregation Width (sec) True Delay (min) • Calculated as estimated TT minus free flow TT • Estimating space mean speed improves accuracy • Combined effect of two errors larger than sum MAPE Time Ratio www.its.pdx.edu All comparisons used the estimates from disaggregated data as ‘ground truth’. www.its.pdx.edu


