
Solar Irradiance Effects on Global Circulation Patterns: A GLIMPSE Study
E N D
Presentation Transcript
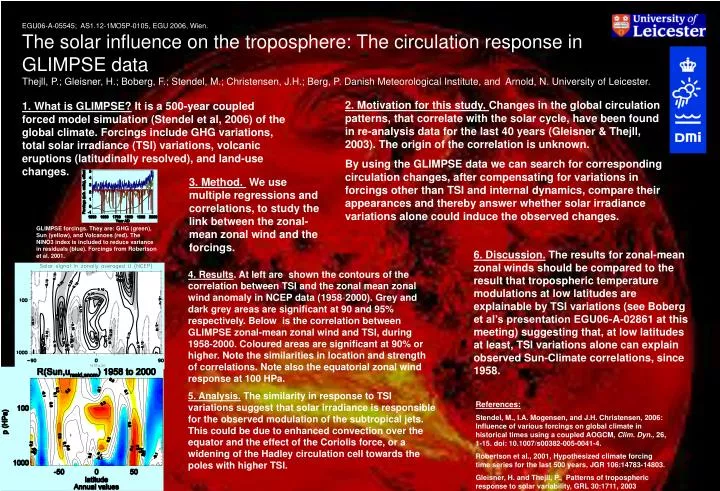
2. Motivation for this study. Changes in the global circulation patterns, that correlate with the solar cycle, have been found in re-analysis data for the last 40 years (Gleisner & Thejll, 2003). The origin of the correlation is unknown. By using the GLIMPSE data we can search for corresponding circulation changes, after compensating for variations in forcings other than TSI and internal dynamics, compare their appearances and thereby answer whether solar irradiance variations alone could induce the observed changes. 1. What is GLIMPSE? It is a 500-year coupled forced model simulation (Stendel et al, 2006) of the global climate. Forcings include GHG variations, total solar irradiance (TSI) variations, volcanic eruptions (latitudinally resolved), and land-use changes. 3. Method. We use multiple regressions and correlations, to study the link between the zonal-mean zonal wind and the forcings. GLIMPSE forcings. They are: GHG (green), Sun (yellow), and Volcanoes (red). The NINO3 index is included to reduce variance in residuals (blue). Forcings from Robertson et al. 2001. 6. Discussion. The results for zonal-mean zonal winds should be compared to the result that tropospheric temperature modulations at low latitudes are explainable by TSI variations (see Boberg et al’s presentation EGU06-A-02861 at this meeting) suggesting that, at low latitudes at least, TSI variations alone can explain observed Sun-Climate correlations, since 1958. 4. Results. At left are shown the contours of the correlation between TSI and the zonal mean zonal wind anomaly in NCEP data (1958-2000). Grey and dark grey areas are significant at 90 and 95% respectively. Below is the correlation between GLIMPSE zonal-mean zonal wind and TSI, during 1958-2000. Coloured areas are significant at 90% or higher. Note the similarities in location and strength of correlations. Note also the equatorial zonal wind response at 100 HPa. 5. Analysis. The similarity in response to TSI variations suggest that solar irradiance is responsible for the observed modulation of the subtropical jets. This could be due to enhanced convection over the equator and the effect of the Coriolis force, or a widening of the Hadley circulation cell towards the poles with higher TSI. References: Stendel, M., I.A. Mogensen, and J.H. Christensen, 2006: Influence of various forcings on global climate in historical times using a coupled AOGCM, Clim. Dyn., 26, 1-15. doi: 10.1007/s00382-005-0041-4. Robertson et al., 2001, Hypothesized climate forcing time series for the last 500 years, JGR 106:14783-14803. Gleisner, H. and Thejll, P., Patterns of tropospheric response to solar variability, GRL 30:1711, 2003