Analysis of MED4 Clones in Supplementary Figure S3 via SgrDI and RsrII Digestion Patterns
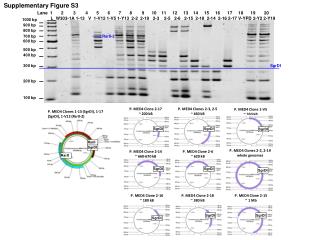
Supplementary Figure S3 presents the band patterns obtained from various MED4 clones (1-20) subjected to SgrDI and RsrII restriction enzyme digestion. The figure illustrates multiple lanes, showcasing the sizes of resultant DNA fragments ranging from 100 bp to 1000 bp. Each lane corresponds to different MED4 clones, emphasizing the distinct genomic profiles. The data reflects insights into the cloning efficiency and structural variations among the clones, providing a comprehensive understanding of the MED4 genomic landscape through visual representation.

Analysis of MED4 Clones in Supplementary Figure S3 via SgrDI and RsrII Digestion Patterns
E N D
Presentation Transcript
Supplementary Figure S3 Lane 1 2 3 4 5 6 7 8 9 10 11 12 13 14 15 16 17 18 19 20 L W303-1A 1-13 V 1-V12 1-V5 1-Y13 2-2 2-19 2-3 2-5 2-6 2-15 2-18 2-14 2-16 2-17 V-YPD 2-Y2 2-Y19 1000 bp 900 bp 800 bp 700 bp RsrII-2 600 bp 500 bp 400 bp 300 bp SgrDI 200 bp 100 bp P. MED4 Clone 2-17 ~ 200 kB P. MED4 Clones 2-3, 2-5 ~ 460 kB P. MED4 Clone 1-V5 ~ 350 kB P. MED4 Clones 1-13 (SgrDI), 1-17 (SgrDI), 1-V12 (RsrII-2) SgrDI SgrDI SgrDI RsrII SgrDI P. MED4 Clones 2-2, 2-19 whole genomes P. MED4 Clone 2-14 ~ 660-670 kB P. MED4 Clone 2-6 ~ 620 kB RsrII SgrDI SgrDI SgrDI P. MED4 Clone 2-16 ~ 180 kB P. MED4 Clone 2-18 ~ 380 kB P. MED4 Clone 2-15 ~ 1 Mb SgrDI SgrDI SgrDI