Download

1 / 87
870 likes | 875 Views
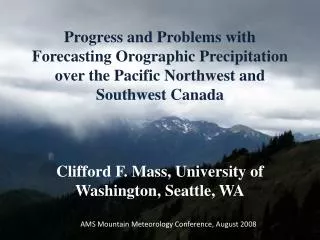
Progress and Problems with Forecasting Orographic Precipitation over the Pacific Northwest and Southwest Canada Clifford F. Mass, University of Washington, Seattle, WA. AMS Mountain Meteorology Conference, August 2008. Orographic Precipitation is an essential part of the regional meteorology.

E N D
Progress and Problems with Forecasting Orographic Precipitation over the Pacific Northwest and Southwest CanadaClifford F. Mass, University of Washington, Seattle, WA AMS Mountain Meteorology Conference, August 2008
Orographic Precipitation is an essential part of the regional meteorology
Few Areas of North America Experience Such Large Amounts and Gradients of Precipitation
Northwest Orographic Precipitation Has Major Societal Impacts Flood Control on Dozens of Dams (Wynochee Dam shown)
Billion-Dollar Storms Are All Associated with Orographic Precipitation
Dec. 3, 200720 inches in two days over coastal terrain of SW Washington The results: massive landslides and river flooding
And, of course, the 2010 Olympics will depend on our understanding and predictive capabilities for orographic precipitation
Northwest U.S. and S.W. Canada an excellent testbed for studying orographic precipitation • Relatively simple terrain of various configurations • Olympics—an orographic island • Vancouver Island and portions of Cascades (linear • Undisturbed flow approaching the barriers • Accessible with a large number of surface observing stations • Major high resolution real-time simulation efforts at the UW and University of British Columbia. • Lack of deep convection.
There have been major progress in understanding and predicting orographic precipitation over this region during the past several decades • A number of regional field experiments have led to substantial advances in understanding.
Major Regional Orographic Precipitation Field Experiments • CYCLES (1970s) • COAST (Dec. 1993, Dec. 1995) • IMPROVE 1 (Jan.-Feb. 2001) • IMPROVE 2 (Nov.-Dec. 2001) • COASTAL OLYMPICS (2003-2004) • Proposed: OLYMPEX 2010
Progress • Long-term real-time NWP and case-specific numerical experiments have examined the strengths and weaknesses of orographic NWP in the region. • Prior to roughly 1995-2000 operational center models lacked the resolution and physics to even begin to handle the regional precipitation. • NWP is now resolving major orographic precipitation features of the region.
2007-2008 12-km UW MM5 Real-time 12-km WRF-ARW and WRF-NMM are similar December 3, 2007 0000 UTC Initial 12-h forecast 3-hr precip.
2007-2008 4-km MM5 Real-time
UW Real-Time Prediction System • Running the MM5 and WRF-ARW at 36-12-4 km since 1996 • Thompson Microphysics • NOAH LSM • Run twice a day to 72h • Verified with thousands of stations from over 70 networks. Long record of model biases and issues over terrain.
A Few Major Lessons • There are several key horizontal scales that influence orographic precipitation. The first is the scale of the major mesoscale barriers (e.g., west slopes of Cascades, mountains of Vancouver Island). • In order to resolve the influence of the these features, one needs grid spacing of 12-15 km.
36-km 12-km
Major Lessons • Then there are smaller scale features, produced by the corrugations in the terrain associated with the river valleys, and smaller-scale features forced by terrain such as the Puget Sound convergence zone. • Such features require 4-km or better grid spacing to get a reasonable handle on the precipitation distributions.
12-km 4-km
Small-Scale Spatial Gradients in Climatological Precipitation on the Olympic Peninsula Alison M. Anders, Gerard H. Roe, Dale R. Durran, and Justin R. Minder Journal of Hydrometeorology Volume 8, Issue 5 (October 2007) pp. 1068–1081
But not so perfect for individual events (issues of resolution, model physics, and initialization, among others)
Perhaps the most detailed look at this scale separation of orographic flows was presented by Garvert, Smull and Mass, 2007 (IMPROVE-2 paper)
Garvert et al. • Used aircraft radar and in situ data from the IMPROVE-2 field experiment, as well as high resolution (1.3 km grid spacing) MM5 output. • Documented and simulated small scale mountain waves and their microphysical/precipitation implications.
During the 1990’s it became clear that there were problems with the simulated precipitation and microphysical distributions over Northwest terrain • Apparent in the daily UW real-time MM5 forecasts at 12 and 4-km • Also obvious in research simulations of major storm events.
Early Work-1995-2000 (mainly MM5, but results are more general) Colle and Mass, 1999;Colle, Mass and Westrick ,2000 • Relatively simple microphysics: water, ice/snow, no supercooled water, no graupel. (explicit moisture scheme of Hsie et al. 1984, with ice-phase microphysics below 0°C Dudhia 1989) was applied in for 36, 12, and 4-km domains. • Tendency for overprediction on the windward slopes, even after considering undercatchment. Only for heaviest observed amounts was there no overprediction. • Tendency for underprediction to the lee of the barrier and in major gaps.
MM5 PrecipBias for24-h90% and 160% lines are contoured with dashed and solid lines For entire Winter season
Problems Were Obvious in the Lee of the Olympics • Lack of clouds and precipitation in model on the lee side in light to moderate events. • Too much precipitation moving over mountains under strong winds.
Testing more sophisticated schemes and higher resolution ~2000 • Testing of ultra-high resolution (~1 km) and better microphysics schemes (e.g., with supercooled water and graupel), showed some improvements but fundamental problems remained: e.g., lee dry bias, overprediction for light to moderate events, but not the heaviest. • Example: simulations of the 5-9 February 1996 flood of Colle and Mass 2000.
Colle and Mass, 2000Little Windward Bias, Too Dry in Lee Windward slope Lee Bias: 100%-no bias
Higher Resolution: changes lee precipitation, but lee bulls eyes of heavy precip develop mountain waves too strong?
Varying Microphysics • Modest changes, with graupel causing high intensity areas in the immediate lee. Most sophisticated microphysics did not necessarily produce the best verification
IMPROVE • Clearly, progress in improving the simulation of orographic precipitation demanded better observations: • High quality insitu observations aloft of cloud and precipitation species. • Comprehensive radar coverage above the barrier • High quality basic state information (e.g., wind, humidity, temperature) • The IMPROVE field experiment (2001) was designed and to a significant degree achieved this.
British Columbia Legend Washington UW Convair-580 Airborne Doppler Radar Cascade Mts. Two IMPROVE observational campaigns: I. Offshore Frontal Study (Wash. Coast, Jan-Feb 2001) II. Orographic Study (Oregon Cascades, Nov-Dec 2001) S-Pol Radar Offshore Frontal Study Area BINET Antenna Olympic Mts. Olympic Mts. Paine Field Univ. of Washington NEXRAD Radar Area of Multi-Doppler Coverage Wind Profiler Rawinsonde Westport Cascade Mts. WSRP Dropsondes Special Raingauges PNNL Remote Sensing Site Columbia R. 90 nm (168 km) Washington Ground Observer S-Pol Radar Range S-Pol Radar Range 100 km 0 Portland Oregon Terrain Heights Coastal Mts. Salem < 100 m Orographic Study Area 100-500 m 500-1000 m 1000-1500 m Newport 1500-2000 m 2000-3000 m > 3000 m Rain Gauge Sites in OSA Vicinity Santiam Pass OSA ridge crest Santiam Pass Orographic Study Area S-Pol Radar Range Cascade Mts. Coastal Mts. Oregon SNOTEL sites CO-OP rain gauge sites Medford California 50 km
The NOAA P3 Research Aircraft Dual Doppler Tail Radar Surveillance Radar Cloud Physics and Standard Met. Sensors Convair 580 Cloud Physics and Standard Met. Sensors