Download
1 / 1
10 likes | 182 Views
Air pollution and their distribution of 24 schools surrounding the municipal waste incinerators in Taipei City. Tzu-Jung Huang, Chang-Chuan Chan Institute of Occupational Medicine and Industrial Hygiene, National Taiwan University College of Public Health. RESULTS and DISCUSSIONS.

E N D
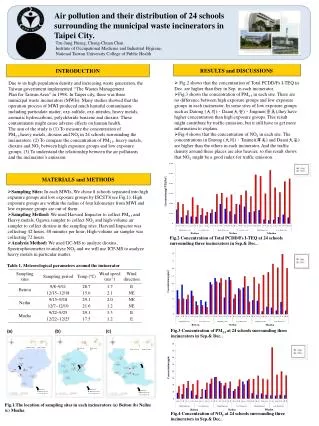
Air pollution and their distribution of 24 schools surrounding the municipal waste incinerators in Taipei City. Tzu-Jung Huang, Chang-Chuan Chan Institute of Occupational Medicine and Industrial Hygiene, National Taiwan University College of Public Health RESULTS and DISCUSSIONS INTRODUCTION • Fig.2 shows that the concentration of Total PCDD/Fs I-TEQ in Dec. are higher than they in Sep. in each incinerator. • Fig.3 shows the concentration of PM2.5 in each site. There are no difference between high exposure groups and low exposure groups in each incinerator. In some sites of low exposure groups such as Datong(大同)、Daan(大安)、Jingmei(景美),they have higher concentration than high exposure groups. This result might contribute by traffic emission, but it still have to get more information to explain. • Fig.4 shows that the concentration of NO2 in each site. The concentrations in Datong(大同)、Tanmei(潭美) and Daan(大安) are higher than the others in each incinerator. And the traffic density around these places are also heavier, so this result shows that NO2might be a good index for traffic emission. Due to its high population density and increasing waste generation, the Taiwan government implemented ‘‘The Wastes Management Plan for Taiwan Area’’ in 1998. In Taipei city, there was three municipal waste incinerators (MWIs). Many studies showed that the operation process of MWI produced much harmful contaminants including particulate matter, oxy-sulfide, oxy-nitrides, heavy metals, aromatic hydrocarbons, polychloride benzene and dioxins. These contaminants might cause adverse effects on human health. The aim of the study is (1) To measure the concentration of PM2.5,heavy metals, dioxins and NO2 in 24 schools surrounding the incinerators. (2) To compare the concentration of PM2.5, heavy metals, dioxins and NO2 between high exposure groups and low exposure groups. (3) To understand the relationship between the air pollutants and the incinerator’s emission. Fig.2 Concentration of Total PCDD/Fs I-TEQ at 24 schools surrounding three incinerators in Sep.& Dec.. MATERIALS and METHODS • Sampling Sites: In each MWIs, We chose 8 schools separated into high expusure groups and low exposure groups by ISCST3(see Fig.1).High exposure groups are within the radius of four kilometers from MWI and low exposure groups are out of them. • Sampling Method: We used Harvard Impactor to collect PM2.5 andHeavy metals, Ogawa sampler to collect NO2 and high-volume air sampler to collect dioxins in the sampling sites. Harvard Impactor was collecting 42 hours, 40 minutes per hour; High-volume air sampler was collecting 72 hours. • Analysis Method: We used GC-MS to analyze dioxins, Spectrophotometter to analyze NO2 and we will use ICP-MS to analyze heavy metals in particular matter. Table 1. Meteorological parameters around the incinerator Fig.3 Concentration of PM2.5 at 24 schools surrounding three incinerators in Sep.& Dec.. (a) (b) (c) Fig.4 Concentration of NO2 at 24 schools surrounding three incinerators in Sep.& Dec.. Fig.1.The location of sampling sites in each incinerators (a) Beitou (b) Neihu (c) Muzha