Handling Data
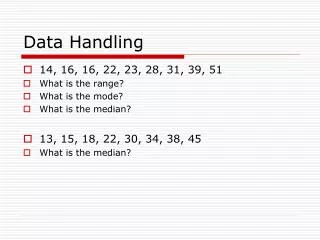
Handling Data. Day 1. L.O. 1 To be able to use the relationship between multiplication and division. L.O.2 To be able to solve a problem by using data in tables, graphs and charts. Test this statement: A quarter of children in Year 5 read 4 or more books last year.

Handling Data
E N D
Presentation Transcript
Handling Data Day 1
L.O. 1 To be able to use the relationship between multiplication and division.
L.O.2 • To be able to solve a problem by using data in tables, graphs and charts.
Test this statement: • A quarter of children in Year 5 read 4 or more books last year. Answering these questions may help….. • Q. How many children are there in total in Year 5? • Q. What is the largest number of books anyone read in the week? • Q. How many children read 4 or more books? • Q. What was the most common number of books read?
With your partner consider…… • Do you have enough information to answer the question? 2. How you could organise the information better? 3. How you could make the data easier to understand? Would a bar chart help? Now find out if the statement is correct.
What scale did you use on the frequency axis? • Could you answer all your questions from your chart?
By the end of the lesson the children should be able to: Discuss a bar chart showing the frequency of an event and check a prediction.
Handling Data Day 2
L.O. 1 To be able to order a set of fractions such as 2, 2 ¾ ,1 ¾ , 2 ½ and position them on a number line.
0 5 Draw a line in your book like this one. Put these fractions on it: 2 ½ 2 ¾ 2 ¼ ¼ 4 ½
0 5 Draw a line in your book like this one. Put these fractions on it: 25/100 50/100 5/2 2 5/10
With your partner discuss what fractions could be written in the blank spaces? 1 minute!
L.O. To understand the term Probability
One day I will play for Manchester United.
Which words could we draw at either end of this line? • Do any of the words have the same meaning?
Where could we put the following statements? 1. I will watch T.V. tonight. 2. I will grow taller than my mother. 3. It will snow at Christmas.
Think of statements which could go at either end of the line. • Prisms….5 statements • Spheres….3 statements • Tetrahedra…2 statements
Where would a 50 – 50 statement go? How else might we say this?
Children should be able to: Discuss events which have a good chance of happening and those which have a poor chance. Place statements on a simple probability scale.
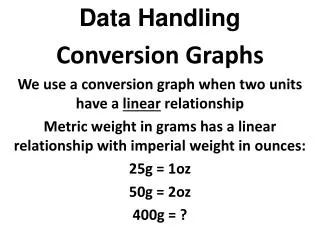
Handling Data Day 3
L.O. 1 To use decimal notation for tenths and hundredths.
Q. How do we say that number? What if it were: money metres & centimetres Kilograms & grams litres & millilitres
L.O. 2 • To be able to solve a problem by representing and interpreting data in bar line graphs.
Q. Who has a lucky number? What is it? Why is it lucky? Can you prove it?
Here is a tally chart : It “proves” that __ is the lucky number!
Work with a partner but record separately… In your book draw a tally chart for die throws. Do 15 throws. Draw a bar line chart of your tally chart – one square=1 throw.
From the information you have on your table can you predict the frequency of each number thrown after : • Prisms 500 throws • Spheres 200 throws • Tetrahedra 100 throws
Class bar line graph. Frequency Score
Q is the class chart more reliable than the one in your book? • Q. When a die is thrown lots of times does each number have the same chance of coming up? • Q. If one number did come up much more than the others when the die was thrown 1000 times what would that tell you?
By the end of the lesson children should be able to: Test a hypothesis about the frequency of an everyday event by collecting data quickly, draw and discuss a bar chart or bar line chart and check the prediction.