Download

1 / 18
190 likes | 214 Views
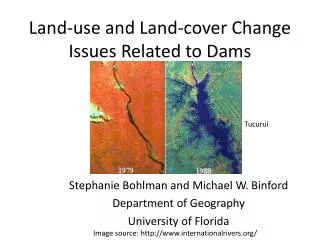
A study on quantifying land use/cover change in Las Vegas, using satellite imagery to analyze trends over time, impacts of rapid population growth, and implications for water resources.

E N D
Detecting Land Cover Land Use Change in Las Vegas Sarah Belcher & Grant Cooper December 8, 2014
Introduction Goals: • To quantify land use/land cover change for Las Vegas over time • Collect necessary data • Determine class scheme • Use skills obtained through lab exercises • Show Results • Validation • Report
Study Area • Rapid Population Growth 1950: 48,589 1990: 741,459 2000: 1,375,765 2004: 1,685,197 2013: 2,027,868 (Est.) • Desert Climate Alluvial Soils Sparse Vegetation Hot, dry summers Satellite imagery courtesy of Digital Globe Inc. http://cdn.teslarati.com/wp-content/uploads/2014/02/LasVegasStrip.jpg
Study Area • Southern Nevada receives 90% of its water supply from the Colorado River • Area has been experiencing drought for the last 14 years • Per capita water use has dropped 40% in the past two decades in Las Vegas http://earthobservatory.nasa.gov/Features/LakeMead/images/mead_2000_lrg.jpg http://www.activistangler.com/storage/Lake_Mead_after_11_years_of_drought.jpg?__SQUARESPACE_CACHEVERSION=1395066723992
Study Area • Previous studies have been conducted on ISA (impervious surface areas) • ISA indicator of non-point source pollution or polluted runoff • Changes in ISA useful indicators of spatial extent, intensity and potentially types of LULC change Source: Xian, G. Analysis of Urban Land Use Change in the Las Vegas Metropolitan Area Using Multitemporal Satellite Imagery. ASPRS 2006 Annual Conference.
Methods • 30m Landsat (5, 7 & 8) imagery • Utilized bands R, G, B, and near IR • All collected in the month of July • All images stacked in ERDAS Imagine Landsat imagery 7/4/1999
Methods • 2010 Census tract for Clark County • Arc Map 10.2 used to select tracts for study area and dissolve boundaries • Projection changed to WGS 1984 UTM completed in Arc Map 10.2
Methods • Each Landsat image subset/clipped based on census tract polygon (AOI) • Improve speed for processing and accuracy of supervised classification
Methods Classes: • Structures • Impervious • Undeveloped • Vegetation • Water • Housing 20 training sites per class
Supervised Classification, Maximum Likelihood • 6 Classes with housing added
Methods 1999-2005 2005-2010 2010-2014
Results • Fda *All areas in hectares
Results • Undeveloped areas decreased 45% • Urban areas increased 41% • Water decreased 26% • Vegetation increased 69%
Limitations • Reference data for classification should have should have had imagery for all four years of interest • Accuracy assessment should have used an independent source, not the World View 1 imagery • Mixed pixels on edges and with roofs/buildings and bare soil
If we Knew What we Know Now… • Data can be very challenging to track down • Scope creep • With more time, we could have: • Obtained high resolution imagery for all four years of interest, possibly more to not used Landsat all together • Done more detailed analysis – added NDVI’s to look at percentage of vegetation over time