MCAS: A Workflow-Driven System for Multisource Operational Data Analysis and Visualization
The Multisource Correlation and Analysis Service (MCAS) transforms legacy operational data into a unified XML format, facilitating effective storage and analysis. By collecting data from various sources like HTML, XML, and log files, MCAS supports visualization, correlation, and historical analysis through a customizable dashboard. This system, utilized in high-energy physics experiments at Fermilab, enhances monitoring and decision-making by providing insights into system performance and operational status across different components, thus optimizing resource management and historical analyses.

MCAS: A Workflow-Driven System for Multisource Operational Data Analysis and Visualization
E N D
Presentation Transcript
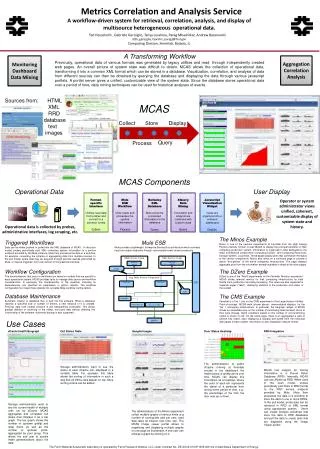
Metrics Correlation and Analysis Service A workflow-driven system for retrieval, correlation, analysis, and display of multisource heterogeneous operational data. Ted Hesselroth , Gabriele Garzoglio, Tanya Levshina, Parag Mhashilkar, Andrew Baranovski {tdh, garzoglio, tlevshin, parag}@fnal.gov Computing Division, Fermilab, Batavia, IL A Transforming Workflow Previously, operational data of various formats was generated by legacy utilities and read through independently created web pages. An overall picture of system state was difficult to obtain. MCAS allows the collection of operational data, transforming it into a common XML format which can be stored in a database. Visualization, correlation, and analysis of data from different sources can then be obtained by querying the database and displaying the data through various javascriptportlets. A portlet server gives a unified, customizable view of the system state. Since the database stores operational data over a period of time, data mining techniques can be used for historical analyses of events. Monitoring Dashboard Data Mining Aggregation Correlation Analysis Sources from: HTML XML RRD database text images MCAS Collect Store Display Query Process MCAS Components Operational Data User Display Operational data is collected by probes, administrative interfaces, log scraping, etc. Collect Process Query Query Display MuleESBWorkflow Mule reads and processes the system information BerkeleyXMLDatabase Mule posts the processed information to the database Operator or system administrator views unified, coherent, customizable display of system state and history. Format-specific Interface Utilities read data from probes and convert to a common format XQueryDataMining Correlation and analysis are combined with custom views JavascriptVisualizationWidget Views are organized into a coherent dashboard The Minos Example Minosis one of the neutrino experiments at Fermilab from the High Energy Physics intensity frontier. It uses MCAS to display the principal elements of their computing production system. Information is organized in tabs dedicated to the major architectural components: Computing Cluster, Grid Computing Resources, Storage System, Local Disk. These pages display plots that summarize the status of the various components. Minos also relies on a summary page to provide a status "at-a-glance" of the entire computing infrastructure. The page displays aggregate plots from the information already available in detail at the other pages. Triggered Workflows Data can be either pushed or pulled into the XML database of MCAS. In the push model, probes periodically post XML containing system information to a service endpoint provided by the Mule instance. Mule then processes the data in a workflow, for example, converting the schema or aggregating data from multiple sources. In the pull model, probe data may be acquired through periodic queries performed by Mule, or may be triggered from user actions in the graphical interface. Mule ESB Mule provides a lightweight Enterprise Service Bus architecture which connects input and output endpoints through customizable event-driven processing. DB Mule Service Comp Mule Service Comp Data feed endpoint Data feed endpoint async Workflow Configuration The transformations that occur in workflows are based on models that are specific to each operational system. MCAS provides tools to manage data source and workflow characteristics. In particular, the characteristics of the workflow, including its dependencies, are specified as parameters in python objects. The workflow configuration tool maps these objects into runnable Mule workflow configurations. The DZero Example DZerois one of the "RunII" experiments on the Fermilab Tevatron accelerator. MCAS shows relevant metrics for their computing infrastructure for both Monte Carlo production and data processing. The views are also organized in separate pages ("tabs"), displaying statistics of the production and status of the system. Agg. Mule Service Component Transform1 Transform sync Database Maintenance Automatic rotation of database files is built into the software. When a database reaches a specified size or number of entries, a new instance of it is created. Previous data from rotated versions is still transparently accessible. This allows gradual deletion or archiving of the oldest, non-used data without affecting the functionality of the software. Automatic backup is also supported. The CMS Example Fermilab is a Tier 1 site for the CMS experiment of the Large Hadron Collider . Proof-of-concept MCAS work (shown above) demonstrated displays for the Tier 1 computing infrastructure. In particular, the bargraphwidget of MCAS shows an immediate view on the number of functioning data transport doors of their local storage. Alarm conditions based on the number of non-functioning nodes is shown in red. On the same page, there is an aggregated a view of several key nodes, each displaying a Ganglia plot pulled from the individual web pages of each system. Information is also displayed in tabular format. aggregator Polling Data sink Data source URL portlet Use Cases dCache Health Bargraph Cell Status Table Ganglia Images Door Status Heatmap RRD Integration Theadministrators of public dCache running at Fermilab include in the dashboard the health status of gridftp doors over time. MCAS can display this information as a heatmap, where the color of each bin represents the status of a particular door during some period of time, e.g., the percentage of the time the door was up or down. Storage administrators want to see the status of each dCache cell, displayed in a sortable table. For example, this table allows the sorting of information in such a way that all offline cells appear on top. More sorting criteria can be added. MCAS has support for storing information in a Round Robin Database (RRD). Internally, MCAS can use JRobinas RRD. When used in the push model, probes periodically post Data in RRD format to the RRD service endpoint provided by Mule. Mule then processes the data in a workflow to store the data in one or more RRDs. In the pull model, probe data can be retrieved in RRD or XML format using appropriate queries . Users can create complex workflows that store the data in RRD databases and pull the data to create plots that are displayed using the Image Viewer portlet. Storage administrators want to see the current health of multiple cells run by dCache. MCAS aggregates and correlates cell status then displays it as a bar graph. The bar graph shows the number of up/down gridftp and dcap doors as well as the number of up/down pools, aggregated by pool group. This allows the end user to quickly make generalizations about the data. The administrators of the Minosexperiment collect multiple graphs of various kinds (e.gnumber of running/idle jobs per user, read data rates on bluearc over time, etc). The MCAS image viewer portlet allows to organizing and displaying multiple graphs on one page as thumbnails. A end-user can enlarge a graph by clicking on it. The Fermi National Accelerator Laboratory is operated by Fermi Research Alliance, LLC under Contract No. DE-AC02-07CH11359 with the United States Department of Energy.