Download
1 / 26
260 likes | 279 Views
This document discusses the data quality requirements for analytical measurements of priority substances and chemical pollutants in water. It includes information on measurement uncertainty, lower limit of application, and achievable data quality by available methods.

E N D
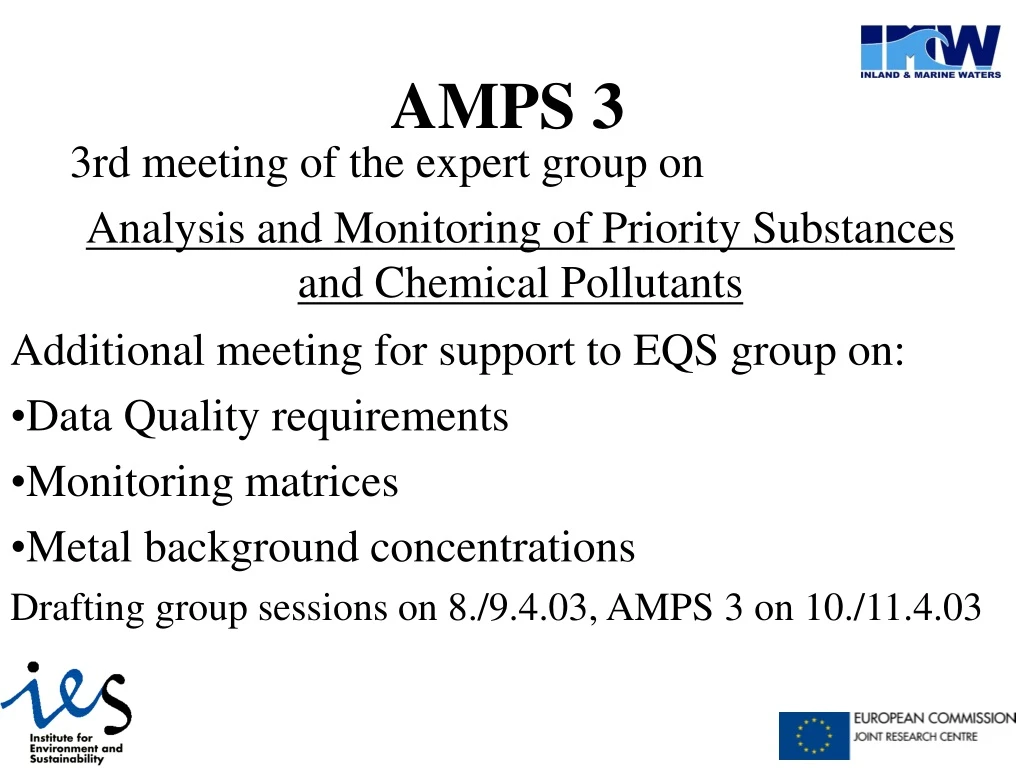
AMPS 3 3rd meeting of the expert group on Analysis and Monitoring of Priority Substances and Chemical Pollutants Additional meeting for support to EQS group on: • Data Quality requirements • Monitoring matrices • Metal background concentrations Drafting group sessions on 8./9.4.03, AMPS 3 on 10./11.4.03
AMPS 3 Documents Prepared by drafting groups, discussed by AMPS, commented: • Data Quality requirements EAF(5)-04-01-AMPS-DQR • Monitoring matrices EAF(5)-04-02-AMPS-Matrices • Estimating natural background concentrations EAF(5)-04-03-AMPS-Background
Reported average value Uncertainty EQS (i) Result + uncertainty above EQS (ii-a) Result above EQS but EQS within uncertainty (ii-b) Result below EQS but EQS within uncertainty (iii) Result + uncertainty below EQS Data quality requirements
Uncertainty total Uncertainty sampling Uncertainty measurement *total = sampling + measurement Specific pattern of PS occurrence in specific waterbody (uncontrolled) adapt suitable sampling strategy (spatial & temporal) Error from analytical measurement methodanalytical quality canbe described andcontrolled * = variance Uncertainty of reported average
Position paper on data quality requirements The objective is to define data quality requirements for analytical measurements. This information should be taken into account when compliance assessment is considered.
The proposed EQS for the water phase were taken as reference for discussion EQS include precautionary factors (10 to 1000) EQS refer to the annual average concentration All discussions on DQR refer to analysis of PS in water The group recognises that quality of measurement will be an important factor for the decision of compliance. However, the decision of compliance of reported data (annual average) is not within the competence (task) of AMPS Basic assumptions
Which data quality elements should be taken into account? What data quality is currently achievable by available methods? What data quality is required? Basic questions
Uncertainty of measurement Def.: Parameter associated with the result of a measurement, that characterises the dispersion of the values that could reasonably be attributed to the measurand. Eurachem guide (2000) Lower limit of application The lower limit of application refers to the lowest concentration for which a method has been validated with specified accuracy. Adopted according to definition of “range of application” ISO/TR 13530 Which data quality elements should be taken into account?
Information on measurement uncertainty from 10 European countries received through questionnaire First ideaon what measurement uncertainty is achievable in routine laboratories in order to propose realistic requirements Uncertainty information for concentrations far above proposed EQS has been excluded What data quality is currently achievable by available methods?
For some of the PS there is currently not enough data for measurement uncertainty available (chloroalkanes, PBDE, tributyltin compounds). For some PS the EQS is much lower than current lower application limits (e.g., tributyltin compounds). For some PS (such as PBDE) data are only available for other matrices than water. Measurement uncertainty (expressed as RSD) for PS has been mostly estimated to be in the range between 10 and 30%. Only for a few PS uncertainty estimates are between 30 and 40% or lower than 10% What data quality is currently achievable by available methods?
From the available data it can be derived that most of the PS can be measured with an uncertainty below 30%. In order to stimulate data quality improvement, a realistic achievable combined standard uncertainty of 25% is proposed Information on the contribution of sampling to uncertainty is not included in the table, although the group considers it as very relevant. Only two out of ten European countries gave some information on uncertainty related to sampling What data quality is currently achievable by available methods?
Laboratories have to be aware that sampling can contribute to overall uncertainty of measurement, but its contribution is difficult to quantify. Based on expert judgement the contribution of taking and transporting samples is considered to be small compared to uncertainty of measurement. To minimise uncertainty associated with sampling, samples should be taken according to international guidelines on sampling in water analysis. The contribution of statistical sampling uncertainty (representativeness, i.e. “when and where” samples are taken) can be very significant and may be even greater than the analytical measurement uncertainty What data quality is currently achievable by available methods?
A table has been drafted to propose required measurement uncertainty (Annex B) Based on the assessment of uncertainty information from 10 European countries a combined standard uncertainty (RSD) of 25% has been proposed as default A coverage factor (for definition see Annex A) of 2 (corresponding to an approximate level of confidence of 95%) is chosen to derive theexpanded uncertainty of 50% What data quality is required?
The lower limit of application is required to be equal or lower than 30% of the EQS. This ensures that PS concentrations around the proposed EQS can be measured with acceptable uncertainty The proposals for required uncertainty and lower limit of application cannot be achieved for several PS at present Laboratories should work according to internationally accepted QA/QC schemes (e.g. as required in the accreditation standard EN/ISO/IEC 17025). What data quality is required?
AMPS has been asked for a recommendation on the suitable monitoring matrix for PS from the viewpoint of the analytical experts in order to support EQS setting. The objective is to give a recommendation on the preferred matrix for surveillance and operational monitoring of PS. Monitoring Matrices for compliance checking of Priority Substances in the WFD
Definition of matrices in aquatic systems. Common understanding of “water” phase, whole water or only dissolved fraction. Partitioning of substances between different phases (Kow/Koc/Kd). The physico-chemical properties of compounds, the water quality and the solid phase composition and concentration (suspended particulate matter/settled sediment) determine the partitioning. Discussion items :
Preference between SPM/ settled sediment depending on monitoring strategy and aim. Keywords are: historic pollution, protection of the benthic organisms, resuspension, sampling of top sediment layer, time/investment needs for SPM sampling, etc. Concentrations and organic matter content of SPM in the water column Dissolved Organic Carbon DOC concentration in water Feasibility of analytical methods in a specific matrix Need for harmonised protocols for the separation of phases and for the analyses of contaminants in “whole water” in presence of large SPM concentration Discussion items :
For a number of compounds the analysis in the water phase is recommended It is not recommended to analyse PBDE in the water phase For some compounds the analysis in the water phase is currently not possible at the proposed EQS levels. Analysis in a different matrix might provide a practical alternative in these cases. For the other compounds no general clear statement can be made at present and further discussion is needed Conclusions
It is desirable to use only one analytical method (matrix) for substance groups (such as PAH) Groups of related substances, such as volatile compounds or some pesticides should be analysed in the same matrix SPM is a suitable matrix for monitoring some hydrophobic substances and metals but requires dedicated instruments and harmonised methods. SPM monitoring is not recommended if the SPM concentration is low. Conclusions
Alachlor Atrazine Benzene Chlorfenvinphos Chlorpyrifos (-ethyl, -methyl) 1,2-Dichloroethane Dichloromethane Diuron Endosulfan Hexachlorobenzene Hexachlorobutadiene Recommended Monitoring Matrix Water for: • Hexachlorocyclohexane • gamma-HCH (Lindane) • Isoproturon • Pentachlorobenzene • Pentachlorophenol • Simazine • Trichlorobenzenes • Trichloromethane
Recommended Monitoring Matrix is other than water for: • Bis(pentabromophenyl)ether • Diphenyl ether, octabromo derivate • Diphenyl ether, pentabromo derivate
Monitoring of priority metals (Cd, Hg, Ni, Pb) in the context of the WFD “Added risk approach” Compilation of methodologies for estimating natural background concentrations Metal background concentrations
“The background concentration of target metals(Pb, Cd, Ni, Hg) in the aquatic ecosystems of a river basin, river sub-basin or river basin management area is that concentration in the present or past corresponding to very low anthropogenic pressure.” This definition is based in its intent on the REFCON Guidance document accepted by the Water Directors in November 2002. Definition
For the purpose of quality standard setting, background concentrations might be estimated under consideration of spatial (and if necessary seasonal) variability. Furthermore, the river basin or river basin management area is defined as the spatial entity that is considered as uniform with regard to the background concentration of a particular metal. Spatial variability
Methodologies for estimating natural background concentrations Dissolved Phase 1. Trace Metal Concentrations in Groundwater • Shallow • Deep • 2. Trace Metal Concentrations in Pristine Areas • 3. Watershed Model • 4. Expert Judgment
Methodologies for estimating natural background concentrations Particulate Phase • Trace Metal Concentrations in Pristine Areas • Calculation using Kd, TSM and [Diss-TM] Kd * [TM-D ] *TSM = [Part-TM]. • Calculation from composition of surface sediments (OM, Inorg Phases; TMs in Phases; Apportioned to TSM • Expert Judgment