Download
1 / 37
370 likes | 392 Views
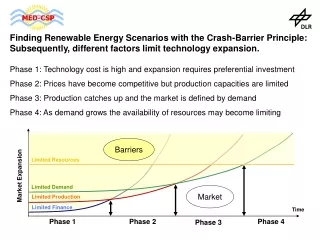
This article explores the limitations and barriers to technology expansion in the renewable energy market. It discusses the phases of expansion and identifies the different factors that come into play. It also provides a technology portfolio and highlights the renewable energy resource mapping.

E N D
Barriers Limited Resources Market Expansion Limited Demand Market Limited Production Limited Finance Time Phase 1 Phase 2 Phase 4 Phase 3 Finding Renewable Energy Scenarios with the Crash-Barrier Principle: Subsequently, different factors limit technology expansion. Phase 1: Technology cost is high and expansion requires preferential investment Phase 2: Prices have become competitive but production capacities are limited Phase 3: Production catches up and the market is defined by demand Phase 4: As demand grows the availability of resources may become limiting
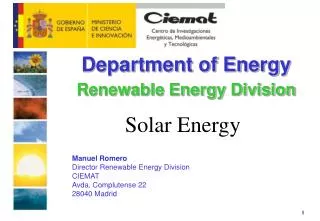
solar tower (SNL) parabolic trough (PSA) parabolic dish (SBP) linear Fresnel (Solarmundo) Technology Portfolio: Concentrating Solar Thermal Power Technologies
Wind Power (Enercon) Solar Chimney (SBP) Hydropower (Tauernkraft) Biomass Power (NREL) Hot Dry Rock (Stadtwerke Urach) Photovoltaic (NREL) Other Renewable Energies for Power
Renewable Energy Resource Mapping Biomass Wind Energy Geothermal Energy Hydropower Solar Energy
Exclusion Areas for Concentrating Solar Thermal Power Plants in Southern Europe and Maghreb Countries
DNI [kWh/m²/y] Solar Thermal Electricity Generating Potentials in Morocco Technical Potential: 20151 TWh/y (DNI > 1800 kWh/m²/y)Economic Potential: 20146 TWh/y (DNI > 2000 kWh/m²/y) Power Demand 2000: 15 TWh/y Power Demand 2050: 235 TWh/y (Scenario CG/HE) Tentative CSP 2050: 150 TWh/y (Scenario CG/HE) Coastal Potential: 300 TWh/y (< 20 m a. s. l.) Water Demand 2050: 1.2 TWh/y (Power for Desalination)
Remarks: No information except for EU. General PV growth rates used for calculation No information except for EU mid term economic potentials from 5000 m temperature map considering areas with T>180°C as economic from DNI and CSP site mapping taking sites with DNI > 2000 kWh/m²/yas economic from wind speed and site mapping taking sites with a yield > 14 GWh/y and from literature (EU) from agricultural (bagasse) and municipal waste and renewable solid biomass potentials well documented resource taken from literature Renewable Electricity Potentials in TWh/year for Iran, the CSP potentials are still rough estimates
Phase 3 Phase 1 Phase 2 Industrial Plant Production Capacity of CSP
Development of Fuel Prices, Solar Share of CSP Plants and CO2-Sequestration Share of Fossil Power Generation in Europe within the MED-CSP Scenario
Discount Rate 5 % 2000-$ Electricity Cost of Power Technologies (Example)
Europe North Africa Western Asia Arabian Peninsula
Europe North Africa Western Asia Arabian Peninsula
At any time, the electricity supply system must cover the power demand with 25 % reserve ( firm capacity )
EU Country (Portugal) CO2 Sequestration
Annual Expenses of Electricity Generation of Business as Usual and MED-CSP Scenarios compared to the Year 2000 With CO2 Sequestration IEA Start Values: Oil: 25 $/bbl, Esc. 1%/y Coal: 49 $/t, Esc. 1 %/y Avoided Cost2015 - 2030 4 B$ Added Cost 2000 – 2015:1 B$
Annual Expenses of Electricity Generation of Business as Usual and MED-CSP Scenarios compared to the Year 2000 No CO2 Sequestration IEA Start Values: Oil: 25 $/bbl, Esc. 1%/y Coal: 49 $/t, Esc. 1 %/y Avoided Cost2020 - 2030 1.9 B$ Added Cost 2000 – 2020:1.4 B$
Avoided Cost250 B$ Oil 25 $/bblCoal 49 $/tonEsc. 1%/y Added Cost75 B$ MED-CSPScenario
Total avoided emissions until 2050: 28 billion tons Per Capita Emission in 2050: 0.58 tons/cap/year
Non-sustainable water includes overexploitation of groundwater resources and desalination with fossil fuels. Sustainable water includes all natural surface and groundwater resources that are renewable and exploitable, plus increasingly re-used wastewater. A possible reduction of renewable water due to climate change is not considered. CSP-Desalination includes seawater desalination on the basis of renewable energy, mainly CSP, in each country within the scenario CG/HE.
Non-sustainable water includes overexploitation of groundwater resources and desalination with fossil fuels. Sustainable water includes all natural surface and groundwater resources that are renewable and exploitable, plus increasingly re-used wastewater. A possible reduction of renewable water due to climate change is not considered. CSP-Desalination includes seawater desalination on the basis of renewable energy, mainly CSP, in each country within the scenario CG/HE.
Sustainable water deficit today: 60 billion m³/y 2050: 160 billion m³/y
Renewable and Unsustainable Capacities for Freshwater in MENA
Solar / Hybrid Electricity and Combined Heat & Power • solar electricity • integrated fossil fuel backup capacity, power on demand • increased solar operating hours, reduced fuel input • additional process heat for cooling, drying, seawater desalination, etc. Thermal Energy Storage Concentrating Solar Collector Field Solar Heat Fuel Electricity Power Cycle Process Heat
Peaking Load 14 % Interest Rate 9 % Interest Rate 4 % Interest Rate Base Load Cost of Electricity by CSP in Cogeneration with MED for 4, 9 and 14% Rate of Return, Water Cost 0.50 $/m³
Cost of Water desalted by CSP in Cogeneration with MED for 4, 9 and 14% Rate of Return, Electricity Cost 4 ct/kWh Cost Range in Selected Remote Regions Cost Range of City Water in MENA 14 % Interest Rate 9 % Interest Rate 4 % Interest Rate Cost of Irrigation
Interconnecting MENA and Europe: The TRANS-CSP Study
2050 15 % 5 % 0 % 80 % • Alternatives for Sustainable Energy and Water in EU-MENA • Oil/Gas: High Cost Escalation • Growing Domestic Needs will compete with Exports • Climate vs. Cost (CO2-Sequestration adds 2 - 3 ct/kWh) • Coal: Less Cost Escalation than Oil & Gas MENA would shift from Energy Exporter to Energy Importer New Source will require Infrastructure and Investment Climate vs. Cost (CO2-Sequestration adds 2 - 3 ct/kWh) • Nuclear: Cost Escalation & Depletion like Oil • MENA would shift from Energy Exporter to Energy Importer • New Source will require Infrastructure and Investment • Security vs. Cost (Nuclear Waste Disposal, Proliferation) • Solar: Cost De-Escalation and High Growth Rates • MENA will export Oil/Gas + Solar Power • New Source will require Infrastructure and Investment • Climate + Security + Low Cost 2000 60 % 20 % 5 % 15 %
What about fusion in EU-MENA ? * using the reference parameters of MED-CSP scenario CG/HE
Main Results of the MED-CSP Study • The present energy system is not sustainable and will lead to a critical situation in terms of economical, social and environmental stability. • The demand for energy will grow by three times until 2050 in EU- MENA, water demand will almost double in the MENA region • Fossil and nuclear energy sources have triggered economic development in the North Western Hemisphere, but cannot be expected to do the same for the rest of the world • A well balanced mix of renewable energy technologies is the least cost option for energy and water security in EU-MENA • The deployment of renewable energies must be accelerated by adequate policy instruments
Policies for Sustainability in the Energy Sector • International Agreement on RES Deployment Strategy • Create Instruments adapted to each Country • Feed in Tariffs • Kyoto Instruments (CT, CDM, JI) • Subsidies (Soft Loans, Grants) • Bidding System and Quotas • Tax Credits • Grid Enhancement • Base Decisions on world market prices Mobilisation Fund ?
Two contemporary statements from the energy establishment: • The elevation of energy costs due to the introduction of renewable energies would seriously burden our economy. • As expected, our economy can cope with the present fuel price escalation rates. One contemporary statement from F.Trieb: • The additional cost caused by fuel price escalation since 2003, even if it would be reversed, already exceeds the total additional cost of market introduction of renewables in the next 20 years ! Thank You !