Download
1 / 54
540 likes | 658 Views
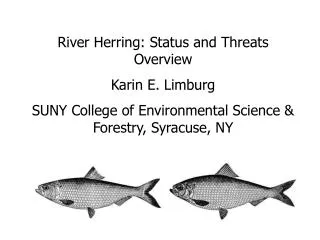
Modeling and Measuring the Process of Watershed Change, and Implications for Fisheries Karin E. Limburg SUNY College of Environmental Science & Forestry. Supported by the Hudson River Foundation and National Science Foundation.

E N D
Modeling and Measuring the Process of Watershed Change, and Implications for Fisheries Karin E. Limburg SUNY College of Environmental Science & Forestry Supported by the Hudson River Foundation and National Science Foundation
Modeling and Measuring the Process andConsequences of Land Use ChangeJon Erickson, Caroline HermansUniversity of VermontJohn Gowdy, Audra Nowosielski, John PolimeniRensselaer Polytechnic InstituteKarin Limburg, Karen Stainbrook, Bongghi HongSUNY College of Environmental Science and ForestryCollaborators:David BurnsDutchess County Environmental Management CouncilEileen SassmanWappinger Creek Watershed Intermunicipal Council
The two paradigms… The natural landscape (watershed) perspective vs the socio-economic perspective… Separate, but in need of linkage!
Bill Odum applied this to ecological systems Economist Alfred Kahn “The Tyranny of Small Decisions”
Biophysical Land Use Society Community Economy Business HouseH Individuals Economic Structure and Change Land-Use and Demographic Change Watershed Health “Connecting the dots”: linking economy, land use, and ecological effects
Research Questions • How does human activity create the demand for land use change? • How does this demand change the spatial pattern of land use? • How does land use change affect ecosystem health? What does all this mean for coastal fisheries?
The Hudson River Watershed – site of case study Hudson River estuary
Geographic Setting Dutchess County, NY 3 assessment approaches, followed by integrative model
HOUSEHOLDS GOVERMENT Public Services Private Goods & Services Consumption Goods Labor INDUSTRY Exports Depreciation OUTSIDE WORLD Imports Investment CAPITAL a) Model the economy with a Social Accounting Matrix • County-Wide Stakeholder Workshop: • Semi-Conductor Industry • Suburbanization • Loss of agriculture • Commuting (↑ traffic)
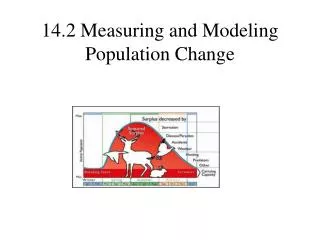
Dutchess CountySemiconductor and relateddevices industry #1 in Value-Added #2 in Employment
b) Land use and demographic change • Quantifying Past & Present Condition • Satellite maps, followed by…
- Land use interpretation Quantifying past & present condition, continued - Ortho-rectified photos • - Tax parcel maps • Developed land use change model
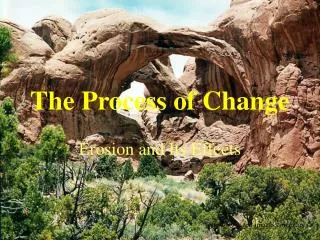
c) Ecosystem health(and watershed health) • maintenance of biotic integrity, resistance and/or resilience to change in the face of anthropogenic disturbance (Rapport, 1992) • includes • physical and chemical environmental quality (e.g., stream temperature, conductivity, and element concentration), • biotic condition (e.g., status of fish and macroinvertebrate communities)
Assessing watershed health: The idea: organisms and ecosystems integrate and reflect the insults (or lack thereof) resulting from watershed-level processes Some techniques have proven robust after 25+ years of testing; others in development
Indicators of ecosystem health can (should?) evaluate changes at levels of • Ecological population • Community/habitat • Whole-system Metrics may not all be additive, although many schemes designed that way
What we looked at: • physical habitat characterizations • water chemistry • biotic community structure (fish and macro-invertebrates) • ecosystem function
Some results: how “healthy” are the Wappinger and Fishkill Creek watersheds? (Fishkill is closer to NY City, more urbanized…) Let’s look at a few diagnostics… Land use patterns Environmental quality patterns Biological indicators …includes changes over time
Assessments at different spatial scales (relates to the degree of influence)
60.0 INTEGRATED Fishkill 50.0 Wappingers 40.0 30.0 20.0 10.0 0.0 Forested Agricultural Developed Other Amount of land in different uses varied at different spatial scales Percent
Hudson Valley, New York 60 Wappinger Creek 50 40 Chloride Concentration (mg/L) 30 20 10 0 F-82 O-83 J-85 J-87 S-88 M-90 D-91 A-93 A-95 D-96 J-98 M-00 N-01 J-03 F-05 Date Conductivity – a measure of the ionic strength of water Correlates strongly with human disturbance (population density, road density, nitrates, etc.) Getting recognition as a bellwether of aquatic disturbance
Fish Index of Biotic Integrity (IBI) • Use fish community characteristics to assess aquatic health – composed of 12 metrics, including • Species richness & abundance • Indicator species (of degradation, e.g.) • Functional role ID • Condition and health indices
IBIs originally worked out for Ohio streams – but are gaining popularity worldwide now However, have to be regionally calibrated We tested the relatively new northern Mid-Atlantic IBI (Daniels et al. 2002. Trans. Amer. Fish. Soc. 131: 1044-1060)
IBIs over time… Fishkill Wappinger Similar results w/ macroinvertebrate analyses
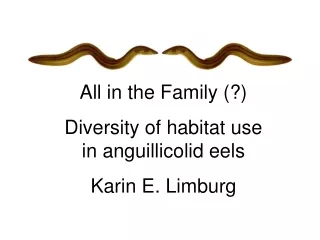
Stable Isotope Analysis. A big field of research in everything from meteorology to archaeology, geology to food science, ecology to physiology Basically a way to trace how elements move from one compound to another, or from one chemical state to another In ecology, we often use Carbon and Nitrogen stable isotope ratios as tracers of matter in food webs – and can also be used to trace migrating animals – and things like pollution…
Less urbanized More urbanized Stable isotope analysis of a “sentinel species” blacknose dace
Integrating through models Social Accounting Matrix (Input-output Model) Binary Logit Regression Model Multiple Linear Regression Model Nowosielski (2002) Polimeni (2002) Stainbrook (2004)
Simulation Result from Socio-economic Sub-model: 2292 new jobs (1000 direct + 1292 indirect) expected number of new jobs
Land Use Change Sub-model 124,549 “Tax Parcels” within Dutchess County
Input Spatial Dataset (Independent Variables for Binary Logit Model) Possible Restriction to Development Total Assessment Value Change in Population Change in Income Distance to Central Business District Neighborhood Index Minimum Lot Size Requirement Hydric Soils Wetlands Steep Area Protected Lands
Predicted Conversion of Vacant Lands to Residential Use in Response to Economic Impact (%)
NAWQA (National Water Quality Assessment) Dataset: Correlation with Percent Urban Land Use correlation coefficient
Result from Ecosystem Health Sub-model: Reduced Stream Water Quality and Species Diversity
We are able to track the effects of economic activity in the watershed…but what does this mean for coastal fisheries?
It’s a matter of scale… Chesapeake Bay Mississippi R. watershed and “The Dead Zone” Image sources: NOAA and Virginia Inst. of Marine Science
Hypoxia increasing Diaz, et al. 2004 Fish & Fisheries declines
Nixon 2002 160 Fisheries landings 140 Pelagic:demersal ratio 120 100 ANNUAL FISHERY LANDING, Kg Ha-1 hypoxia 80 60 40 20 Eutrophication severity Eutrophication severity (chl) 0 0 100 200 300 400 500 Caddy 2000, de Leiva Moreno 2000 PRIMARY PRODUCTION, g C m-2 y-1 Caddy 1993 System-wide effects?
1900 1850 1950 2000 Dams Over Time* *not including dams missing dates Data from BASINS software