Day 1
Day 1. 8:30 am Welcome 8:45 am Introductions 9:00 am Table Talk 1- What is Data Wise? 10:00 am Table Talk 2 and 3- Data Conversation 11:30 am Lunch 1:00 pm Table Talk 4-Digging Into Data. Day 2. 8:30 am Reflection

Day 1
E N D
Presentation Transcript
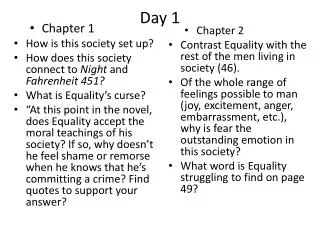
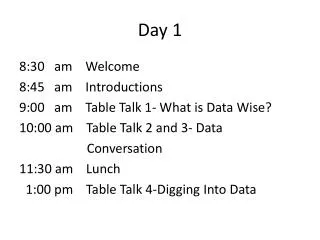
Day 1 8:30 am Welcome 8:45 am Introductions 9:00 am Table Talk 1- What is Data Wise? 10:00 am Table Talk 2 and 3- Data Conversation 11:30 am Lunch 1:00 pm Table Talk 4-Digging Into Data
Day 2 8:30 am Reflection 9:00 am Table Talk 5- Analyze Current Practice 10:30 am Table Talk 6- Why? Why? Why? 11:30 am Lunch 1:00 pm Table Talk 7-Learning to See 2:00 pm Table Talk 8- Going Back to School
What Data Wise Is and Isn’t It IS . . . • A process • A way to structure improvement • Grounded in multiple forms of data • Collaborative It is NOT . . . • A program • An add-on • Just about using test data • A solo activity
A Culture of Inquiry Using the Data Wise Improvement Process
Phase 1- Prepare Lay the ground work for collaboration and data use.
Organize for Collaborative Work • Adopt an improvement process • Set aside time for collaborative work • Launch a data team • Attach each faculty member to a team • Create a system of teams • Inventory data and initiatives
Build Assessment Literacy • Explore assessment instruments • Study assessment reports • Apply assessment terms & principles • Learn about misuses of data • Begin to make connections between test data and classroom generated assessments
Data Overview • Choose a focus • Determine the story • Display the data • Plan how to use data in meetings • Generate questions for the Inquiry Phase
Phase 2- Inquiry “Groups work together to explore data from a range of sources in an effort to understand students’ learning and teachers’ practice.” Boudette and Steele (2007).Data Wise in Action: Stories of Schools Using Data to Improve Teaching and Learning. Cambridge, MA ( Harvard Education Press, 2007)
Dig into Data • Use a wide range of data including projects, quizzes and class work • Triangulate data sources • “Indentify a gap in skill or understanding common to many students that, if corrected would have far reaching implications for students’ continued academic growth known as a learner –centered problem.” Boudette and Steele (2007).Data Wise in Action: Stories of Schools Using Data to Improve Teaching and Learning. Cambridge, MA ( Harvard Education Press, 2007)
Examine Instruction • Collect evidence of what is happening in classrooms • Identify a “problem of practice: an instructional challenge that teachers believe is worth tackling collectively.” • Develop shared understanding of effective practice Boudette and Steele (2007).Data Wise in Action: Stories of Schools Using Data to Improve Teaching and Learning. Cambridge, MA ( Harvard Education Press, 2007)
Develop an Action Plan • Decide on an instructional strategy • Agree on what the plan will look like in classrooms • Put the plan down on paper • Make sure the plan addresses the Learner Centered Problem • Make sure the plan addresses the Problem of Practice
Phase 3- Act “Educators develop and carry out a plan for addressing the problem of practice and improving student performance.” Boudette and Steele (2007).Data Wise in Action: Stories of Schools Using Data to Improve Teaching and Learning. Cambridge, MA ( Harvard Education Press, 2007)
Plan to Assess • Set short, medium and long term goals • Select a range of data to measure progress
Act and Assess • Implement your action plan • Monitor how well the action plan is being carried out • Execute the plan for assessing progress • Make midcourse adjustments
Act and Assess • Integrate plan into work of the school • Visit classrooms • Review data and make adjustments
The Data Overview “We need to get everyone talking about data.”
Case Study: McKay K-8 School Problem: The principal presented a data overview depicting gains in mathematics and a shocking decline in language arts. She did not get the creative brainstorming she hoped for. “ You could hear a pin drop. I was not prepared for the silence-I felt like I had dropped a bomb.”
Case Study: McKay K-8 School Second Data Overview Presentation Used a second Data Overview to tell a story using more historical data Used objectives to frame the conversation Used discussion prompts Pointed out areas of improvement Connected the presentation to AYP goals Used Mini Data Overviews during the school year
Case Study: McKay K-8 School Third Data Overview Presentation Planning and presentation was a team effort The team considered how data could be better incorporated in to the school culture The bulk of the Data overview meeting was dedicated to small group work on goal-setting activities, and to brainstorm areas of student performance to further investigate
Case Study: McKay K-8 School Third Data Overview Presentation Teachers presented the Data Overview Used varied sources of data Used different data presentation formats- graphs and tables
Data Overview Choose a focus Determine the story Display the data Plan how to use data in meetings Generate questions for the Inquiry Phase
Purpose of today’s meeting To start a conversation and generate questions for inquiry into reading performance at Primary grades by looking at how our students performed on the state test last spring.
What do you see? What questions do you have about what you see?
What do you see? What questions do you have about what you see?
How will our teams work together to explore these questions?
Data Overview Discussion What went well about our Data Overview Conversation? Do you see an emerging story? If so, what is it? If not, what else do you need to see? How will you improve upon this Data Overview Conversation?
The Data Overview Conversation The Data Team prepares the data for the teams. Teams look at their data to generate questions. Teams use the questions to set up the Professional Learning Communities. The Data Overview changes as the year goes on to include recent data.
Step 2- Decide Which Discussion Questions to Use Sample Questions What do you see? What questions do you have? What do you notice? What more would you like to know about it? What’s going on in the data? What do you see that makes you say that? What more can you find in the data?
Table Talk 2Practice: With Your Team • Create graphics for your data. • Practice generating questions about the data using the process modeled. • Discuss how you will set up the data conversation (s) at your school. Who will facilitate the conversations? When will the conversations take place? How will the Data Team keep track of the questions?
Practice: With Another Team Facilitate a conversation about your data (do not present it or share your questions-get the other team to generate questions about it). Compare the two sets of questions.
Table Talk 3- Digging Into Data This is the most commonly misunderstood step of the Data Wise Process. Let’s talk about the different between drilling into a single data source and digging into data.
What is a Learner-Centered Problem? A learner – centered problem is a gap in skill or understanding common to many students that, if corrected, would have far reaching implications for students’ continued academic growth.
What tools are helpful when digging into data? • Student Self- Assessments • Student Work done in class • Interview Data • Student work from a test • Timed student work • Tests • Quizzes • Projects
Drilling Down into one Data Source Aggregated Disaggregated Strand Item Analysis Student Work
Benchmark Assessments Quarterly or End of Unit Aggregated Disaggregated Strand Item Student Work
Formative Common Assessments1 to 4 times per month Math Problem of the week Writing Samples Science Journals Projects Oral Presentations Group Projects
Daily Formative Assessment Student Self- Assessment Descriptive Feedback Conference Notes Written response Discussion
Focus Evaluate inferences, conclusions, and generalizations and provide evidence by referencing the text (s).
How can we assess our students’ performance related to evaluating inferences, conclusions, and generalizations by referencing text without practicing test questions over and over again?
Digging Into Reading Data Learner Centered Problem
Case: West Hillsborough Elementary School Problem: The strong culture of collaboration was not translating into gains in student achievement. Goal: The goal was to narrow the focus of the improvement efforts and broaden the definition of data.
Importance of Multiple Measures “ Some assessments don’t measure what we need to measure. For instance, the benchmark assessments tell us a lot, but for some students not enough. Certain kids will score 11 out of 12 or 12 out of 12 on the multiple choice assessment, but still cannot write a paragraph connecting the story to a real life event or compare and contrast one story with another.” pg. 78
Case: West Hillsborough Elementary School Action Steps: West Hillsborough decided to build on practices that were already in place- analyzing interim assessment data (pg. 76); Look at student work by following the performance of a small number of individuals known as “focal students”;.
Case: West Hillsborough Elementary School Creating personalized education plans for all students and allow them to dig into their own data.