Download

1 / 11
110 likes | 297 Views
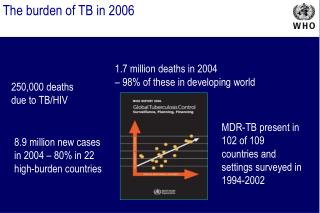
A new perspective on TB disease burden and TB control in Viet Nam Lessons from a prevalence survey. Philippe Glaziou Geneva, 12 October 2009. The problem with case detection rates. CDR not directly measurable Optimal TB surveillance systems capture almost all incident cases

E N D
A new perspective on TB disease burden and TB control in Viet NamLessons from a prevalence survey Philippe Glaziou Geneva, 12 October 2009
The problem with case detection rates • CDR not directly measurable • Optimal TB surveillance systems capture almost all incident cases • If surveillance is suboptimal, then what is directly measurable? • Prevalence (survey) • Mortality (vital registration) • Diagnosed patients: inventory studies • Mapping of providers • Size of diagnosed but not notified TB population
High case detection and treatment success but no decline in notifications in Vietnam: Why?
Prevalence survey showed prevalence much higher than previously thought *Source: Prof Sy. Report of the National TB Prevalence Survey in Vietnam, 2006-7
Estimating the case detection rate from a prevalence measurement • CDR = N/P / (N/P + 1/d) [1] d denotes the average duration of disease • Duration: triangular distribution from 1 to 4 years, mode at 2 years (EV = 2.3) • Prevalence: normal distribution around point prevalence estimate from the survey, s.e. adjusted for sampling design [1] Borgdorff M. New measurable indicator for tuberculosis case detection. EID 2004; 10(9): 1523-1528
Chronic cough lacks sensitivity,importance of relapses • Only 53% of prevalent sputum smear positive cases reported chronic cough • 22% of ss(+) cases previouslytreated for TB (8-month regimen used in past) • 36% more than 2 years before • 64% recently, 63% of them successfully • Sex ratio (M/F) = 4.5 (bacteriologically confirmed cases)
Private providers • 8% of 326 suspects with history of TB treatment were treated in the private sector • PPM intervention project (HCMC)+18% notifications in PPM districts over 1 year (-1% in other HCMC districts) • Internal migrants moving to cities tend to access care from the private sector
In-depth analysis of surveillance data Decline in notifications in older age groups, increase in young adults
Lessons learned • Disease burden higher than previously thought: keep TB high on the political agenda • Notifications estimated to reflect trends in incidence, declining at an age standardized rate of -2%/yr, but increasing in 15-24 yr-old group • Importance of accounting for changes in demographic structure • Large pool of unreported cases in private sector • PPM, link with hospitals • Electronic recording and reporting • Improve screening, expand active case finding
Conclusions • Prevalence surveys provide robustmeasurement of national coverage and impact of TB control • Combined with in-depth analysis of surveillance data, survey results help • understand and interpret epidemiological patterns and trends • update policies on TB screening and care • improve reporting • address the needs of at-risk populations