Download
1 / 29
290 likes | 459 Views
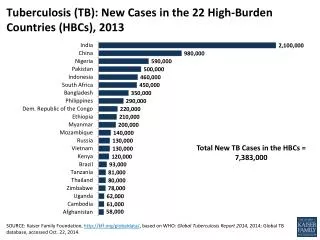
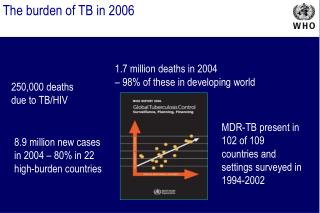
The burden of TB in 2006. 1.7 million deaths in 2004 – 98% of these in developing world. 250,000 deaths due to TB/HIV. MDR-TB present in 102 of 109 countries and settings surveyed in 1994-2002. 8.9 million new cases in 2004 – 80% in 22 high-burden countries.

E N D
The burden of TB in 2006 1.7 million deaths in 2004 – 98% of these in developing world 250,000 deaths due to TB/HIV MDR-TB present in 102 of 109 countries and settings surveyed in 1994-2002 8.9 million new cases in 2004 – 80% in 22 high-burden countries
Asia has the highest number of cases and TB has resurged in Europe... 0 - 999 1000 - 9999 10 000 – 99 999 100 000 - 999 999 1 000 000 or more No estimate AMERICAS 4% EAST. MEDIT. 7% EUROPE 5% Estimated number of new cases (all forms)
Global incidence is rising at 1% due to increases In Africa and E. Europe World exc Afr EEur Africa - high HIV 400 300 Africa - low HIV 200 Estimated TB incidence/100K/yr World E Europe 100 0 1990 1995 2000 2005
WHO European Region 53 countries 18 high priority countries for TB 25 EU countries
TB case notification rate in EUR, 1980-04 Annual TB cases per 100,000 pop. 295,240 East+ EUR (18 countries) 354,954 All EUR (53 countries) 373,497 54,231 European Union (25 countries) Year
TB incidence in EUR 50/100 000 - overall TB incidence in EUR • 13/100 000 - first fifteen members of the EU • 27/100 000 - ten new members of the EU (enlargement in 2004) • 53/100 000 - four countries accessing the EU • 98/100 000 - countries bordering EU
Mean annual change in TB notification rates, 2000-2004 % change No data / <60 cases/yr -11% to -3% -2% to +1% +2% to +6% >+6% EuroTB
Andorra Malta Monaco San Marino % cases of foreign origin No data 0-4 5-19 20-39 40+ Proportion of TB cases of foreign origin, Europe, 2004 EuroTB
Global TB control targets 2015:50% reduction in TB prevalence and deaths by 2015 2015:Goal 6: Combat HIV/AIDS, malaria and other diseases Target 8: to have halted by 2015 and begun to reverse the incidence… Indicator 23: prevalence and deaths associated with TB Indicator 24: proportion of TB cases detected and cured under DOTS 2005:World Health Assembly: - To detect at least 70% of infectious TB cases - To treat successfully at least 85% of detected cases
population (%) no DOTS < 10 10-90 > 90 DOTS in EUR 1995 - 6 countries; 2004 - 43countries, 47% population
TARGET Plan to Stop TB in EEUR: achievements • STOP TB strategy: • DOTS • MDR-TB, TB/HIV, prisons • Health system • All providers • ACSM, people, patients • Research Note: DOTS achievements in new smear-positive pulmonary TB cases
% of pulmonary cases 60% Moldova, Rep Kyrgyzstan 45% Armenia Georgia 30% Kazakhstan Turkmenistan Azerbaijan 15% 1999 2000 2001 2002 2003 2004 Proportion of pulmonary cases with positive sputum smear, East*, 1999-2004 * including countries where pulmonary classification was applied for three or more consecutive years
Treatment outcomes, new definite pulmonary cases*, 2003 * Culture positive in EU & West and Centre; smear positive in Macedonia FYR and East. Countries with nationwide representative data; excluding 4 countries with < 10 cases (EU & West) § Mean percentage (country range in brackets) EuroTB
Outcomes among new, definite pulmonary TB cases, EU & other regions, 2003* Despite low mortality rates, the proportion of TB patients notified in the EU who die while on treatment is substantial, even when compared to other regions in the world. This is one limitation keeping many EU countries from achieving the WHO target of 85% success among previously untreated pulmonary TB cases. * Mean for 19 EU countries (EuroTB); data from other regions refer to DOTS cohorts (WHO Global Tuberculosis Control: Surveillance, Planning, Financing. 2006)
East – West divide EuroTB
Why the new Stop TB Strategy ? Vision, Goals, Objectives Vision:A WORLD FREE OF TB Goal:To dramatically reduce the global burden of TB by 2015 in line with the MDGs and the Stop TB Partnership targets Objectives: • Achieve universal access to high-quality diagnosis and patient-centred treatment • Reduce the human suffering and socio-economic burden associated with TB • Protect poor and vulnerable populations from TB, TB/HIV and multidrug-resistant TB • Support development of new tools and enable their timely and effective use
What are the main challenges ? • DOTS not yet fully expanded and of high quality everywhere • TB/HIV, especially in Africa, and MDR-TB, especially in former USSR and China • Weak health systems and services impeding proper TB control and care • Not all practitioners engaged • Communities un-aware and un-involved • Research not producing yet new tools and outside of the interest of TB "controllers"
Western and Central Europe • Today, mainly sexual transmission in Western and Central Europe • Exceptions: significant IDU epidemics in ESP, POR, ITA, SWI, POL • 25-65% of all cases are among MSM • Up to 75% of all heterosexual cases are among immigrants from high prevalence countries and women are >50% of all heterosexual cases • Vulnerable Groups: MSM & immigrants, specially immigrant women
Eastern Europe • Mainly IDU related transmission in Eastern Europe • 68-85% of all cases are male • Up to 30% of infected females are IDU and 50% are partners of IDU • 30-50% of all HIV infections are among those under 25 years • Vulnerable Groups: IDU, sex workers, prisoners, ethnic minorities, migrants
<20% 20-40% 40-60% 60-80% >80% 10% 84% 6.1% 6% 13% 2% 50% IDU as % of all HIV/AIDS casesNOTE: % of AIDS cases in countries not reporting HIV Sources: EuroHIV; national reports; 11% 0% 25.5% 19.4% 17% 14.5% 87% 16% 90% 34% 81% 83% 6% 71% 82% 80% 16% 24% 5% 71% 29% 29% 82% 20% 2% 74% 86% 16% 32% 7% 64% 11% <1% 15% 51% 60% 68% 4% 60% 14% 3% 57% 5% 8.2% 16% 1.8% 16%
<20% 20-40% 40-60% 60-80% >80% 72% 76% 76% 61% 78% 85% 83% Males as % of all HIV/AIDS casesNOTE: % of AIDS cases in countries not reporting HIV Sources: EuroHIV; national reports; 78% 62% 25.5% 75% 71% 75% 75% 16% 77% 68% 73% 89% 78% 71% 63% 79% 81% 81% 80% 66% 61% 80% 84% 85% 73% 72% 80% 97% 80% 80% 63% 90% NA 74% 77% 71% 69% 80% 72% 82% 78% 80% 70% 83% 64%
Access to HAART, 03/2003 RUS EST LAT LIT BEL UKR KAZ MOL ROM GEO UZB KYZ BUL AZE ALB ARM TKM TJK TUR BIH, FYM, YUG no HAART (<1%) good coverage (>70%) poor access ( 1-10%)partial coverage (10-70%)
Access to HAART, 01/2006 RUS* BEL UKR* KAZ* UZB* AZE* ARM* TKM TJK* no HAARTvery poor coverage ( 1-10%) * in the process of scaling up ART poor coverage (10-50%) moderate coverage (50-75%) disputed coverage estimates or insufficient data available good coverage (over 75%)
HIV infection among TB cases, 1998-2004* The proportion of TB cases with HIV infection has increased in Estonia and Latvia, but is still highest in Portugal and Spain. In other countries of the Balkans and East providing data, levels have remained below 1%. * Excluding countries with less than 2 datapoints in the last 3 years or less than 50 TB notifications annually
Reported to WHO (2005) 52,800 TB patients HIV tested 5,800 tested positive 14 started the ART
Estimated HIV prevalence 2005 % HIV prevalence estimated in general population and TB patients (adults) Source: UNAIDS (2004); WHO Global TB Report (2006)
European Framework for TB/HIVInterim policy on collaborative TB/HIV activities • Establish the mechanism for collaboration • Set up a coordinating body for TB/HIV • Conduct surveillance of HIV prevalence among TB patients • Joint TB/HIV planning • Conduct monitoring and evaluation • Decrease the burden of TB in people living with HIV/AIDS • Intensified TB case finding • Introduce INH preventive therapy • Ensure TB infection control in health care and congregate settings • Decrease the burden of HIV in TB patients • Provide HIV testing and counselling • Introduce HIV prevention methods • Introduce co-trimoxazole preventive therapy • Ensure HIV/AIDS care and support • ART
Cat 1: national adult HIV prevalence >1% or HIV prevalence in TB pts >5%: all activities recommended in the Interim policy to be considered for implementation • Cat 2: national adult HIV prevalence below 1% and administrative areas with adult HIV prevalence >1% - combination of Cat 1 and Cat.3 • Cat 3: national adult HIV prevalence below 1% and no administrative areas with adult HIV prevalence >1%: • Conduct surveillance of HIV prevalence among TB patients • Decrease the burden of TB in people living with HIV/AIDSwith focus on groups at high risk for TB and HIV – IDUs, MSM, sex workers, those living in congregate settings)