Download
1 / 7
70 likes | 235 Views
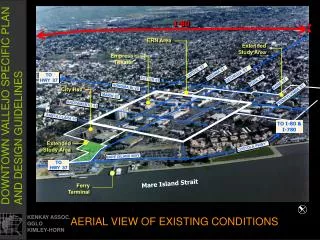
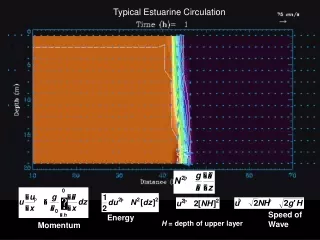
FIGURE 1.1 Idealized oblique aerial view of a typical estuarine system showing some of the major subsystems. FIGURE 1.2 Idealized cross section through a typical estuary showing vertical distribution of several important elements; note that organism sizes and vertical scale are exaggerated.

E N D
FIGURE 1.1 Idealized oblique aerial view of a typical estuarine system showing some of the major subsystems.
FIGURE 1.2 Idealized cross section through a typical estuary showing vertical distribution of several important elements; note that organism sizes and vertical scale are exaggerated.
FIGURE 1.3 Idealized longitudinal section through a typical estuary from river to the sea. The vertical scale is exaggerated, and the darker area near the sediment surface indicates an oxidized zone.
FIGURE 1.4 Food web diagram for a typical estuarine ecosystem showing some feeding links among some of the major trophic groupings. Black lines and arrows indicate flow of food from source to consumer.
FIGURE 1.5 An energy-flow diagram illustrating some major structural and functional attributes of estuarine ecosystems. Note that the five types (shapes) of symbols used are defined along the bottom of the figure.
FIGURE 1.6 An energy-flow diagram illustrating how ordering and disordering energies are related in estuarine ecosystems. The status of an ecosystem results from a balance between energy sources, which build structure and order, and energy stresses, which cause a loss of structure and order (a). For estuaries, there are three main kinds of energy sources: sunlight, water movement (due to gravity, tides, and waves), and inputs of organic or inorganic nutrients (b). Three general kinds of energy stresses are (i) energy diverted from the system, (ii) microscale or entropic disordering, and (iii) harvest and other forced losses (c). See text for further discussion. Source: Figures from Odum and Copeland, 1972, used by permission.
FIGURE 1.7 A functional classification of coastal ecosystems based on important energy sources and stresses. Source: From Odum and Copeland, used by permission.