Download
1 / 22
220 likes | 296 Views
Explore the intricate balance of Lake Superior's ecosystem through the study of stable isotopes, trophic levels, and species interactions since 1929. Learn about fish community objectives, food web structures, stable isotopes' role in indicating trophic levels and production sources, and the implications for key species. Discover the recommendations for sustainable management practices and the effects of historical events on the lake's biodiversity.

E N D
Ecological Interactions in Lake Superior Sean Cox, Chris Harvey, and Jim Kitchell Center for Limnology University of Wisconsin, Madison
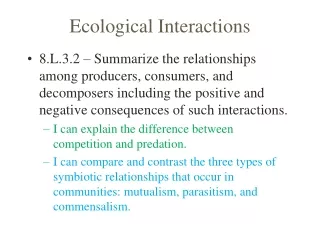
Fish community objectives (FCOs) • Self-sustaining forage fish populations • Maintaining native fish community • Self-sustaining lake trout populations • Self-sustaining populations of salmon
Outline • Lake Superior food web structure: Stable Isotopes • Simulating ecological and fishery interactions: 1929-1998 • Recommendations
Siscowet L.T. Burbot 5 D. sculpin Chub Whitefish S. sculpin 4 Herring Mysis 3 Diporeia Zooplankton 2 Detritus Phytoplankton Lake Superior pelagic food web (ancestral) Trophic Level
5 4 3 2 Lake Superior pelagic food web (modern) Sea lamprey Steelhead Siscowet L.T. Coho Burbot Chinook Smelt D. sculpin Chub Whitefish S. sculpin Trophic Level Herring Mysis Diporeia Zooplankton Detritus Phytoplankton
Trophic structure: Stable Isotopes What are they? • Heavy to light isotope ratio in tissues • 15N/14N and 13C/12C • Fractionate predictably up food chain
Trophic structure: Stable Isotopes What are they used for? • Tracers of long-term diet history • d15N indicates trophic level • d13C indicates production source
Top predator 10 Forage fish 7 Zooplankton 3 Phytoplankton 0 -30 -26 -18 -22 Trophic structure: Stable Isotopes d15N (‰) Trophic level d13C (‰) Production source
Trophic structure: Western L. Superior 12 Deep Food Web Siscowet Burbot Lean 10 Kiyi Chinook S. Sculpin 8 Bloater Herring d15N (‰) Trophic level Coho Dws Mysis 6 Smelt Cal. Copepods Shallow Food Web 4 Diporeia Cycl. Copepods 2 Seston Cladocerans 0 -24 -32 -30 -28 -26 d13C (‰) Production source
16 Lake herring diet only 14 12 10 8 6 Transformers 4 Parasites Spawners 2 0 0 100 200 300 400 Isotopes indicate diet changes d15N (‰) Trophic level Lamprey body mass (grams)
Fishery Catch - Catch - Effort USGS Trawl Survey - Biomass - Recruitment Exotic Invasion - Smelt - Sea lamprey Food Web Structure - Stable isotopes - Food habits Ecosystem Simulation Model Species Interactions - Competition - Predation Fishery Interactions Simulating ecological interactions Stock Assessment - Biomass - Recruitment - Harvest rates
Changes in major species since 1930 Biomass / Biomass in 1930
Deep water food web Chub Biomass / Biomass 1930 Siscowet
Deep water food web Biomass / Biomass 1930
Shallow water food web Biomass / Biomass 1930
Key Ecological Effects • System continues to respond to invasion and collapses that occurred more than 50yrs ago • Mysis and smelt facilitate energy transfer between deep and shallow food webs • Potentially important interaction between whitefish and herring
Recommendations • Whitefish may be headed for moderate decline as they approach carrying capacity • Siscowet too, but magnitude is uncertain • Develop management plan aimed specifically • at recovery of lake herring
3.0 2.5 2.0 1.5 1.0 0.5 0.0 0.0 0.5 1.0 1.5 Compensatory recruitment Age-1 Recruitment Spawning stock
Lake herring recruitment, 1929-1970 Age-1 Recruitment Spawning stock
1971-1998 Depensatory recruitment Age-1 Recruitment Spawning stock