Download
1 / 20
220 likes | 500 Views
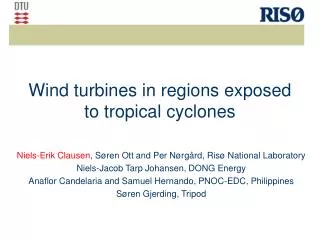
Wind turbines in regions exposed to tropical cyclones. Niels-Erik Clausen , Søren Ott and Per Nørgård, Risø National Laboratory Niels-Jacob Tarp Johansen, DONG Energy Anaflor Candelaria and Samuel Hernando, PNOC-EDC, Philippines Søren Gjerding, Tripod. Outline. Tropical cyclones

E N D
Wind turbines in regions exposed to tropical cyclones Niels-Erik Clausen, Søren Ott and Per Nørgård, Risø National Laboratory Niels-Jacob Tarp Johansen, DONG Energy Anaflor Candelaria and Samuel Hernando, PNOC-EDC, Philippines Søren Gjerding, Tripod
Outline • Tropical cyclones • Tropical cyclones and wind turbines • Extreme wind from tropical cyclones • Impact on design and cost • Conclusions Cat. 4 tropical cyclone IVAN 15 Sept 2004 at landfall near Luisiana, USA (NASA/GSFC) EWEC 2007 7-10 May Milan, session BW4
EU-ASEAN Wind project Feasibility assessment and capacity building for wind energy development in the Philippines, Vietnam and Cambodia. Project period: Feb. 2005 – Dec. 2006 Risø National Laboratory (coordinator) Denmark Innovation Énergie Développement France Mercapto Consult Denmark PNOC Energy Development Corporation Philippines Institute of Energy Vietnam Ministry of Industry, Mines and Energy Cambodia The project is financially supported from the EC-ASEAN Energy facility through the ASEAN Energy Centre in Jakarta. Contract 125-2004.
A tropical cyclone Initially a rotating collection of thunderstorms over a warm sea water surface. Tropical depression <17 m/s Tropical storm 17-32 m/s Tropical cyclone >32 m/s (hurricane, typhoon) Average 48 TC per year globally (20 - 35 years data) EWEC 2007 7-10 May Milan, session BW4
Geographical distribution of tropical cyclones The Philippines NW Pacific average 17 TC per year EWEC 2007 7-10 May Milan, session BW4
Sea water temperatures T > 26.5 C Sea water temperatures in May 2001. Source: MODIS Ocean Group, NASA/ GSFC and Miami University)
Damaged wind farms Gujarat, India 1998 (left and top) Japan: Miyakojima wind farm after being hit by a typhoon Sept. 2003 (right)
NorthWind, Bangui Bay, Philippines This wind farm have survived two typhoons but with damage to cabling (flooding) 57 km 69 kV transmission line to substation Power back-up for yaw system Photo by NorthWind EWEC 2007 7-10 May Milan, session BW4
St. Ana Dinagat Island ASEAN wind case study EWEC 2007 7-10 May Milan, session BW4
Sta. Ana, Philippines The mast is located 10 m asl Measurement heights 10 and 27 m EWEC 2007 7-10 May Milan, session BW4
Tropical storm near Sta. Ana in 2005 SW NE EWEC 2007 7-10 May Milan, session BW4
Analysis of typhoon best track data 2006 1977-2005 2005 Data Japan Meteol. Agency JMA 2004 Only parts of tracks with Vmax > 50 knots are shown
Estimation of U50 • Choose a grid of observation points (e.g. 1x1) • For each typhoon track find the smallest distance from the observation point to the track • Calculate the corresponding Vmax using a model for dist. versus V (Holland’s model). Neglect Vmax if below 50 knots • Find all the yearly maxima • Repeat for observation points in the grid covering the NW Pacific • Find U50 from the 28 yearly maxima at each grid point assuming a Gumbel distribution EWEC 2007 7-10 May Milan, session BW4
Extreme wind atlas for Western N Pacific U50 10 min average 10 m above sea based on JMA typhoon tracks 1977-2005
Comparison with Philippine Structural Code 3 sec gust 10 m height land (3 cm) 10 min av 10 m height over sea
Cost impact from typhoon design Assumptions for simple cost model • Grid connection costs are disregarded • The foundation contributes about 1/6 of the total costs • The rotor, the nacelle, and the tower contribute each about one 1/3 third of the remaining 5/6 • The rotor-nacelle-assembly is basically design-driven by fatigue • Approx. 1/2 of the tower and foundation costs are assumed driven by extreme loads • The extreme load driven costs are assumed proportional to the load, which is proportional to the square of the mean wind speed Vav and the load safety factor γf EWEC 2007 7-10 May Milan, session BW4
Estimated impact on wind turbine cost In the standard IEC 61400-1 the partial safety factor is 1.35, and for wind turbine class IA Vref = 50 m/s This is the reference For typhoon area we estimate the partial safety factor of 1.7 leading to cost increases of: 50-year wind 60 m/s: 20% 50 year wind 70 m/s: 30% EWEC 2007 7-10 May Milan, session BW4
Sta. Ana 30 MW wind farm U50 was found to 67 m/s in 80 m height Met mast Wind farm
Conclusions • U50 can be estimated from best track data • Cost increase est. 20-30% for wind turbines Next steps • Improved knowledge of site design data • Ground measurements of TC pass • Assess impact on design (cost model) • Design guidelines and application examples EWEC 2007 7-10 May Milan, session BW4
Thank you for your attention More info at www.aseanwind.eu or at the Risø stand F012 Wednesday 9 May 15:30