Download
1 / 1
20 likes | 242 Views
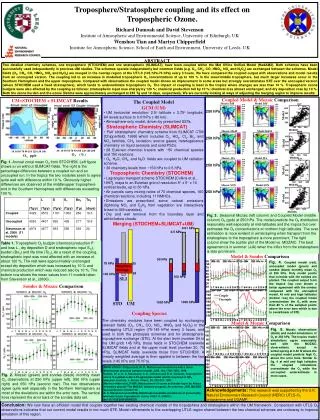
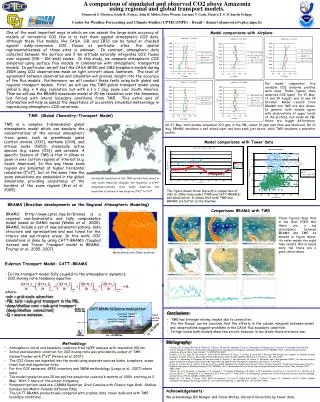
BRAMS (Brazilian developments on the Regional Atmospheric Modeling). Eulerian Transport Model: CATT-BRAMS. TM5 (Global Chemistry-Transport Model). CATT-BRAMS 3D Eulerian model grid box. Model top 20-30 km. convective transport by deep cumulus. convective transport by shallow cumulus.

E N D
BRAMS (Brazilian developments on the Regional Atmospheric Modeling) Eulerian Transport Model: CATT-BRAMS TM5 (Global Chemistry-Transport Model) CATT-BRAMS 3D Eulerian model grid box Model top 20-30 km convective transport by deep cumulus convective transport by shallow cumulus mass outflow plume rise y ~ 10-100 km wet deposition x ~ 10-100 km dry deposition diffusion in the PBL source z ~ 100- 1000 m A comparison of simulated and observed CO2 above Amazonia using regional and global transport models. Demerval S. Moreira, Saulo R. Freitas, John B. Miller, Peter Wouter, Luciana V. Gatti, Monica T. S. D'Amelio Felippe Center for Weather Forecasting and Climate Studies (CPTEC/INPE) – Brazil – demerval.moreira@cptec.inpe.br One of the most important ways in which we can assess the large-scale accuracy of models of terrestrial CO2 flux is to test them against atmospheric CO2 data. Although these flux models, like CASA, SiB, and IBIS can be tuned or checked against eddy-covariance CO2 fluxes at particular sites, the spatial representativeness of these sites is unknown. In contrast, atmospheric data collected between the surface and 5 km altitude naturally integrates CO2 fluxes over regional (105 – 106 km2) scales. In this study, we compare atmospheric CO2 simulated using surface flux models in combination with atmospheric transported models. In particular, we will test the CASA-GFED and SiB3 biosphere models during 2004 using CO2 observations made on light aircraft above Santarem. The level of agreement between observation and simulation will provide insight into the accuracy of the flux models. Furthermore, we will conduct these tests using both global and regional transport models. First, we will use the TM5 global transport model using global 6 deg. x 4 deg. resolution, but with a 1 x 1 deg. zoom over South America. Then we will use the BRAMS mesoscale model at 20 km resolution over the Amazonia, but forced with lateral boundary conditions from TM5. This extra axis of information will help us assess the importance of accurately simulated meteorology in reproducing atmospheric CO2 variations.. Model comparisons with Airplane For model comparison five available CO2 airborne profiles were used. These figures show observed CO2 (ppm) for 27 May, 13 and 29 August, and 13 and 29 October. Model results from BRAMS and TM5 are also shown. In general, both models agree with observations at upper levels of the profiles, but inside de PBL there are bigger differences. TM5 is a complex 3-dimensional global atmospheric model which can simulate the concentrations of the various atmospheric trace gases, such as greenhouse gases (carbon dioxide (CO2), methane (CH4), and nitrous oxide (N20)), chemically active species (e.g. ozone (O3)), and aerosols. A specific feature of TM5 is that it allows to zoom in over certain regions of interest (e.g. South American). In this way these zoom regions are simulated at higher horizontal resolution (1ºx1º), but at the same time the zoom simulations are embedded in the global simulations, providing consistency at the borders of the zoom regions (Krol et al., 2005). On 27 May, both models simulated 370 ppm in the PBL, about 10 ppm less than was observed. On 13 Aug, BRAMS simulates a well mixed layer and have peak just above, while TM5 simulates a smoother profile. Model comparisons with Tower data Horizontal resolution of the TM5 version that zooms in over South American. Globally, the resolution is 6ºx4º(longitude×latitude). Over South American, the resolution is refined in two steps via 3ºx2ºto 1ºx1º. The figure shows three line with a comparison of CO2 in ~50m from model (TM5 and CATT-BRAMS) and observation. It shows that both TM5 and BRAMS are better in the daytime. Comparisons BRAMS with TM5 BRAMS (http://www.cptec.inpe.br/brams) is a regional, non-hydrostatic and fully compressible model based on RAMS model (Walko et al., 2000). BRAMS include a set of new parameterizations, data structure and optimizations and was tuned for the tropics and sub-tropics areas. In this work, CO2 simulations is done by using CATT-BRAMS (Coupled Aerosol and Tracer Transport model to BRAMS, Freitas et al., 2005, 2007). These figures show that in low level (1000 mb) there are a big discordance between BRAMS and TM5. As showed in figure above, it’s refer mainly the night time results. But in levels more tall there are a good concordance. Model domain with 20km resolution. • In-line transport model fully coupled to the atmospheric dynamics, • CO2 mixing ratio tendency equation where: • adv = grid-scale advection • PBL turb = sub-grid transport in the PBL • deep/shallow conv = sub-grid transport (deep/shallow convection) • Q = source emission. Conclusions: • TM5 has stronger mixing, maybe due to convection; • For the fluxes, can be conclude that the offsets in the column integrals between model and observations suggest problems in the CASA flux boundary condition; • In high levels both models show few errors, however in low levels there are more one. Bibliography: • Freitas, S.R., K. Longo, M. Dias, R. Chatfield, P. Dias, P. Artaxo, M. Andreae, G. Grell, L. Rodrigues, A. Fazenda and J. Panetta.: The Coupled Aerosol and Tracer Transport model to the Brazilian developments on the Regional Atmospheric Modeling System (CATT-BRAMS). Part 1: Model description and evaluation. Atmos. Chem. Phys. Discuss., 7., 8525-8569, 2007. • Freitas, S. R., K. Longo, M. Silva Dias, P. Silva Dias, R. Chatfield, E. Prins, P. Artaxo, G. Grell and F. Recuero. Monitoring the transport of biomass burning emissions in South America. Environmental Fluid Mechanics, DOI: 10.1007/s10652-005-0243-7, 5 (1-2), p. 135 – 167, 2005. • Krol, M., S. Houweling, B. Bregman, M. van den Broek, A. Segers, P. van Velthoven, W. Peters, F. Dentener, and P. Bergamaschi (2005), The two-way nested global chemistry-transport zoom model TM5: algorithm and applications, Atmospheric Chemistry and Physics, 5, 417-432 . • Longo, K., S. R Freitas, A. Setzer, E. Prins, P. Artaxo, and M. Andreae. The Coupled Aerosol and Tracer Transport model to the Brazilian developments on the Regional Atmospheric Modeling System (CATT-BRAMS). Part 2: Model sensitivity to the biomass burning inventories. Atmos. Chem. Phys. Discuss., 8571-8595, 2007. • Peters, W., A. R. Jacobson, C. Sweeney, A. E. Andrews, T. J. Conway, K. Masarie, J. B. Miller, L. M. P. Bruhwiler, G. Petron, A. I. Hirsch, D. E. J. Worthy, G. R. van der Werf, J. T. Randerson, P. O. Wennberg, M. C. Krol, and P. P. Tans (2007), An atmospheric perspective on North American carbon dioxide exchange: CarbonTracker, PNAS, 104(48), 18925-18930. • Walko, R.L., L.E. Band, J. Baron, T.G.F. Kittel, R. Lammers, T.J. Lee, D. Ojima, R.A. Pielke, C. Taylor, C. Tague, C.J. Tremback, and P.L. Vidale: Coupled atmosphere-biosphere-hydrology models for environmental modelling, J. Appl. Meteor., 39, 931-944, 2000. Methodology • Atmospheric initial and boundary condition from NCEP analysis with resolution 100 km. • Initial and boundary condition for CO2 mixing ratio was provided by output of TM5 CarbonTracker with 1ºx1º (Peters et al. 2007). • The CO2 fluxes are ingested into the model using separate sources/sinks: biosphere, ocean, fossil fuel and vegetation fires. • For fire CO2 emissions, GFED inventory and 3BEM methodology (Longo et al., 2007) where used. • The model resolution was 20 km and the simulation covered 6 months of 2004, starting on 2 May. With 3 hours of the output frequency. • Parameterizations used are: CARMA Radiation, Grell Cumulus with Closure type Grell, Shallow Cumulus and Mellor-Yamada diffusion Eddy. • The CATT-BRAMS products was compared with airplane data, tower dada and with TM5 boundary conditions. Acknowledgements: We acknowledge Bill Munger and Steve Wofsy, Harvard University by tower data.