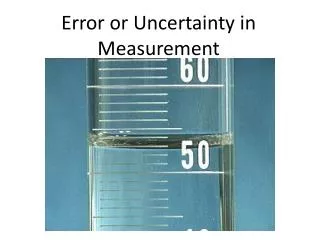
Error and Uncertainty in Modeling
Error and Uncertainty in Modeling. George H. Leavesley, Research Hydrologist, USGS, Denver, CO. Sources of Error and Uncertainty. Model Structure Parameters Data Forecasts of future conditions. Sacramento. Conceptualization of Reality. measurement. Effective Parameters and States.

Error and Uncertainty in Modeling
E N D
Presentation Transcript
Error and Uncertainty in Modeling George H. Leavesley, Research Hydrologist, USGS, Denver, CO
Sources of Error and Uncertainty • Model Structure • Parameters • Data • Forecasts of future conditions
Sacramento Conceptualization of Reality
measurement Effective Parameters and States real world heterog. input output identical Identical ? homog. (xeff,eff) input output model After Grayson and Blöschl, 2000, Cambridge Univ. Press
Precipitation Measurement Mountain blockage of radar 1000M 3000M 2000M SAHRA – NSF STC Sparse precip gauge distribution Source: Maddox, et. al. Weather and Forecasting, 2002.
Streamflow Measurement Accuracy (USGS) • Excellent • 95% of daily discharges are within 5% of true value • Good • 95% of daily discharges are within 10% of true value • Fair • 95% of daily discharges are within 15% of true value • Poor • Do not meet Fair criteria Different accuracies may be attributed to different parts of a given record
Dimensions of Model Evaluation From Wagener 2003, Hydrological Processes
Dimensions of Model Evaluation From Wagener 2003, Hydrological Processes
Performance Measures Mean (observed vs simulated) Standard deviation (observed vs simulated) Root Mean Square Error (RMSE) Mean Absolute Error (MAE)
Performance Measures Coefficient of Determination R2 Not a good measure -- High correlations can be achieved for mediocre or poor models
Performance Measures Coefficient of Efficiency E Widely used in hydrology Range – infinity to +1.0 Overly sensitive to extreme values Nash and Sutcliffe, 1970, J. of Hydrology
Performance Measures Index of Agreement d Range 0.0 – 1.0 Overly sensitive to extreme values Willmott, 1981, Physical Geography
Performance Measure Issues • Different measures have different sensitivities for different parts of the data. • Are assumptions correct regarding the nature of the error structures (i.e. zero mean, constant variance, normality, independence, …)? • Difficulty in defining what constitutes an acceptable level of performance for different types of data.
Dimensions of Model Evaluation From Wagener 2003, Hydrological Processes
Definitions • Uncertainty analysis: investigation of the effects of lack of knowledge or potential errors on model components and output. • Sensitivity analysis: the computation of the effect of changes in input values or assumptions on model output. EPA, CREM, 2003
Parameter Sensitivity The single, “best-fit model” assumption
Error Propagation Magnitude of Parameter Error 5% 10% 20% 50% %> VAR 0.23963 0.95852 3.83408 23.96303 %> SE 0.11974 0.47812 1.89901 11.33868 soil_moist_max 0.15243 0.60973 2.43891 15.24316 %> VAR 0.16210 0.64840 2.59359 16.20993 %> SE 0.08102 0.32367 1.28849 7.80071 hamon_coef 0.10311 0.41245 1.64981 10.31133 %> VAR 0.07889 0.31556 1.26224 7.88900 %> SE 0.03944 0.15766 0.62914 3.86963 ssrcoef_sq 0.05018 0.20073 0.80293 5.01829 joint 0.32477 1.29908 5.19632 32.47698
et baseflow soil moisture routing gw rech gw rech routing soil moisture et Objective Function Selection
SR = (QPRED / PI)*(PI / QPRED) ¶ ¶ Relative Sensitivity
Relative Sensitivity Analysis Soil available water holding capacity Evapotranspiration coefficient
Relative Sensitivity Analysis Snow/rain threshold temperature Snowfall adjustment
Parameter Sensitivity The “parameter equifinality” assumption • Consider a population of models • Define the likelihood that they are consistent with the available data
Regional Sensitivity Analysis • Apply a random sampling procedure to the parameter space to create parameter sets • Classify the resulting model realizations as “behavioural” (acceptable) or “non-behavioural” • Significant difference between the set of “behavioural” and “non-behavioural” parameters identifies the parameter as sensitive Spear and Hornberger, 1980, WRR
Sensitive Not sensitive B = non-behavioural Regional Sensitivity Analysis B = behavioural
Generalized Likelihood Uncertainty Analysis (GLUE) • Monte Carlo generated simulations are classified as behavioural or non-behavioural, and the latter are rejected. • The likelihood measures of the behavioural set are scaled and used to weight the predictions associated with individual behavioural parameter sets. • The modeling uncertainty is then propagated into the simulation results as confidence limits of any required percentile.
behavioural Dotty Plots and Identifiability Analysis
Rockies Sierras Cascades Parameter Equifinality Regional Variability (inches) Uncalibrated Estimate (deg F)
Increasing the information content of the data A single objective function: • cannot capture the many performance attributes that an experienced hydrologist might look for • uses only a limited part of the total information content of a hydrograph • when used in calibration it will tend to bias model performance to match a particular aspect of the hydrograph Multi-criteria Analysis A multi-criteria approach overcomes these problems (Wheater et al., 1986, Gupta et al., 1998, Boyle et al., 2001, Wagener et al., 2001).
Developing Objective Measures peaks/timing quick recession baseflow
Pareto Solutions Pareto Optimality
RMSE min BIAS min Overall Performance Measures
Dimensions of Model Evaluation From Wagener 2003, Hydrological Processes
Solar Radiation PET Observed SCE Final SCE Annual Runoff Percent Groundwater Daily Q 0.7 0.8 0.9 Nash-Sutcliffe 1991 1993 1995 1997 1991 1993 1995 1997 J F M A M J J A S O N D J F M A M J J A S O N D 1991 1993 1995 1997 Year Year Month Month Year Day Evaluation of Model Component Processes
Coupling SCA remote sensing products with point measures and modeled SWE to evaluate snow component process Integrating Remotely Sensed Data
Identifiability Analysis Identification of the model structure and a corresponding parameter set that are most representative of the catchment under investigation, while considering aspects such as modeling objectives and available data. Wagener et al., 2001, Hydrology Earth System Sciences
Dynamic Identifiability Analysis - DYNIA Information content by parameter
Dynamic Identifiability Analysis - DYNIA Identifiability measure and 90% confidence limits
A Wavelet Analysis Strategy • Daily time series • Seasonally varying daily variance (row sums) • Seasonally varying variance frequency decomposition (column sums) • Annual average variance frequency decomposition John Schaake, NWS
Variance Decomposition Variance Transfer Functions Precipitation Streamflow 1-Day 8 day window 8-Day 64 day window
Obs Linear SAC PRMS Streamflow
Obs Linear PRMS SAC Variance Transfer Functions
Probability of exceedence Simulate to today Ensemble Streamflow Prediction Using history as an analog for the future NOAA USGS BOR Predict future using historic data