Download
1 / 11
110 likes | 477 Views
Uncertainty/Error in Measurment. Year 11 DP Chemistry R. Slider. Uncertainty and Error. All experimental measurements contain some amount of uncertainty because we are limited by the precision of the instruments that we are using.

E N D
Uncertainty/Error in Measurment Year 11 DP Chemistry R. Slider
Uncertainty and Error All experimental measurements contain some amount of uncertainty because we are limited by the precision of the instruments that we are using. Error in measurement is introduced when instruments are calibrated incorrectly or used incorrectly.
Random vs. Systematic Random Uncertainties Systematic Error Random uncertainty comes from fluctuations in measurements that can be greater or less than the actual result. These often stem from the limitations of the equipment being used or limitations of the experimenter (e.g. how precisely you can read a scale) These errors can never be eliminated completely, but can be reduced by using repeats Systematic error always affects the measurement in one direction only These are due to either flaws in an instrument that is calibrated incorrectly (giving readings that are too high for example) or from experimenter error such as in parallax error where, for example, the readings are consistently too low These are reduced by good experimental design
Reporting Uncertainty Analogue instruments Digital instruments Instruments such as thermometers and measuring cylinders have various divisions The uncertainty of an analogue scale is +/- half of the smallest division Digital readouts such as electronic balances have various precision levels The uncertainty of a digital scale is +/- the smallest scale division
Precision and Accuracy • Precision refers to how close repeated measurements are to one another (has the least uncertainty/random errors) • Accuracy refers to how close a value is to an accepted (true) value. Small systematic errors lead to accurate measurements.
Precision and Accuracy Example: Two groups are determining the gas constant value (8.314 J/mol K). Results are: Group A: 8.537; 8.487; 8.598; 8.492; 8.472 (Avg=8.517) Group B: 8.13; 7.94; 8.44; 8.54; 8.22 (Avg =8.25) Which group is more precise? Group A (less variation/uncertainty) Which group is more accurate? Group B (closer to accepted value)
Significant Figures Significant figures (s.f.) establish the precision of a number. The rules: • All non-zero numbers are ALWAYS significant (e.g. 1, 2, 3...) • Zeroes between 2 non-zero or 2 significant numbers are ALWAYS significant. • Zeros used to locate a decimal point (placeholders) are NOT significant • Zeroes which are SIMULTANEOUSLY to the right of the decimal point AND at the end of the number are ALWAYS significant • The last significant figure on the right is the one which is somewhat uncertain For operations: • When adding/subtracting, the number of digits to the right of the decimal is the same as the number with the fewest digits to the right • When multiplying/dividing, the number of s.f.in the answer is the same as the least number of s.f. in any of the original numbers.
Significant Figures Examples Determine the number of s.f. in each of these numbers and the rule # that led you to that conclusion. Tabulate results. • 48,923 • 3.967 • 900.06 • 0.0004 • 8.1000 • 501.040 • 3,000,000 • 10.0
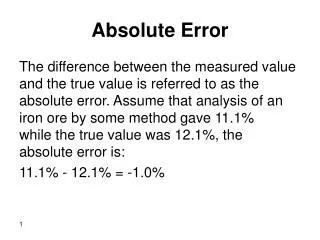
Absolute and % Uncertainty Once you have determined the uncertainty of a single measurement (as a ± value) you can easily determine % uncertainty. For example: You determine the mass of a sample to be 24.56 ±0.01g. Your absolute uncertainty is 0.01g and % uncertainty = (o.o1÷24.56) x 100 = o.04%
Absolute and % Uncertainty When multiple readings are combined, the following rules apply: • Addition/subtraction – add the absolute uncertainties • Multiplication/division – add the % uncertainties • Exponents – multiply the exponent by the % uncertainties