Download
1 / 54
540 likes | 727 Views
Human Population Growth and Environmental Consequences (Various Sources). Case study: China’s one-child policy. In 1970, China’s 790 million people faced starvation. The average Chinese woman gave birth to 5.8 children. The government instituted a one-child policy.

E N D
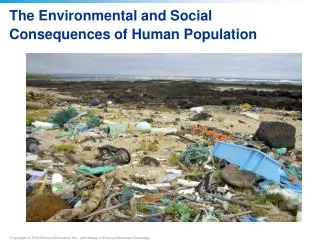
Human Population Growthand Environmental Consequences(Various Sources)
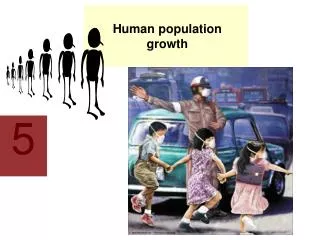
Case study: China’s one-child policy • In 1970, China’s 790 million people faced starvation. • The average Chinese woman gave birth to 5.8 children. • The government instituted a one-child policy. • China’s growth rate plummeted. • The government first used education and outreach and later instituted rewards and punishments. • In 1984, the policy exempted ethnic minorities and farmers. • The program has been both successful and controversial. • The low growth rate makes it easier to deal with challenges. • It has produced unintended consequences: killing female infants and a black-market trade in teenage girls.
Human population: 6.75 billion • Populations continue to rise in most countries. • Particularly in poverty-stricken developing nations • Although the rate of growth is slowing, we are still increasing in absolute numbers. It would take 30 years, counting once each second, to count to a billion!
The human population is still growing rapidly • It took all of human history to reach 1 billion. • In 1930, 130 years later, we reached 2 billion, and added the most recent billion in 12 years. We add 80 million people each year (2.5 people/second).
Reasons for the population boom • Late 1800s – discoveries from Louis Pasteur and others led to germ theory: • diseases were caused by “germs” including bacteria, viruses, and parasites transmitted by food, water, insects, and rodents • Vaccineswere developed for many diseases and populations were immunized against many diseases like smallpox, diphtheria, and typhoid
Lowering the death rate • Cities and towns treat drinking water and sewage • 1930s penicillin discovered, the first in a long line of antibiotics that could cure pneumonia, blood poisoning, and other illnesses caused by bacteria • More productive agriculture, refrigeration, transport and shipping all helped improve nutrition
Major causes of population growth • Better sanitation • Medicine • Improved nutrition • These factors greatly decreased mortality (death rate) • Helped produce the exponential population growth seen since the 1800s
Population growth affects the environment • The IPAT model: I = P x A x T • Our total impact (I) on the environment results from the interaction of population (P), affluence (A), and technology (T). • Population: individuals need space and resources and produce waste • Affluence: per capita resource use • Technology: allows increased exploitation of resources • But can also reduce our impact (e.g., decrease emissions) • Further model refinements include: sensitivity of the environment to impacts, education, laws, ethics
Demography • All population principles apply to humans. • Environmental factors limit population growth. • The environment has a carrying capacity for humans. • Humans can raise the environment’s carrying capacity through technology. • How many humans can the world sustain? • 1–33 billion • Quality of Life? • What will nature look like?
Rates of growth vary from region to region • At today’s 1.2% global growth rate, the population will double in 58 years (70/1.2 = 58). • If China’s rate continued at 2.8%, it would have had 2 billion people in 2004.
Growth rates are decreasing, but… Falling growth rates do not mean a decreasing population, but only that rates of increase are slowing.
Poverty and population growth are correlated • Poorer societies have higher growth rates than wealthier societies. • They have higher fertility and growth rates, with lower contraceptive use. • Poverty results in environmental degradation. 99% of the next billion people added will be born in poor, less-developed regions that are least able to support them.
Factors affecting total fertility rate • Total fertility rate (TFR): the average number of children born per female • Replacement fertility: TFR that keeps the size of a population stable • For humans, replacement fertility = 2.1 • Urbanization decreases TFR. • Access to medical care • Children attend school and impose economic costs • With social security, elderly parents need fewer children to support them. • Greater education allows women to enter the labor force, with less emphasis on child rearing.
Empowering women reduces growth rates • Fertility rates drop when women gain access to contraceptives, family planning programs, and better educational opportunities. • In 2007, 54% of married women worldwide used contraception. • China = 86%; the U.S. = 68%; 20 African nations < 10% Women with little power have unintended pregnancies.
Population policies and family planning work • Many countries provide incentives, education, contraception, and reproductive health care. • Funding and policies that encourage family planning lower population growth rates in all nations. • Thailand has an educational based approach to family planning and its growth rate fell from 2.3% to 0.7%. • Brazil, Mexico, Iran, Cuba, and other developing countries have active programs.
The wealth gap and population growth cause conflict • The stark contrast between affluent and poor societies causes social and environmental stress. • Tensions between “haves” and “have-nots” are increasing.
Rich Nations, Poor Nations • The World Bank, part of the United Nations, divides countries into 3 main categories • High income, highly developed, industrial • 964 million people total • Middle income, moderately developed • 2.7 billion people total • Low income, developing countries • 2.65 billion people total
Disparities • Developed countries are 16% of the population yet control 81% of the wealth (using gross national income) • Low-income developing countries control 3.4% of the wealth but have 41% of the population • Distribution of wealth within countries is also disproportionate – poor people in poor countries face dire circumstances • E.g., the recent talk of the “99 percent” in our country highlighting the fact that 1% of the US population controls about 40% of the wealth
Growth in Rich and Poor Nations • Developed nations: 965 million growing at a rate of 0.1% per year = <1 million/year • Developing nations: 5.35 billion growing at a rate of 1.6% per year = >76 million/year • 98% of the population growth is occurring in developing countries that already have trouble providing for their citizens • Other interesting facts about nations can be found at http://hdr.undp.org/hdr2006/summaries.cfm
Consequences of Growth • Prior to the industrial revolution, most of the world survived through subsistence agriculture, the land they lived on provided enough food for their own consumption and for barter • i.e., people lived on “current sunlight” • Forests provided firewood, timber, and game • Rivers, lakes, and rain provided water • All of this changed with the industrial revolution • Switched to dependency on “ancient sunlight”
The Earth can’t support our consuming lifestyle Humanity’s global ecological footprint surpassed Earth’s capacity to support us in 1987.
Urban Sprawl • Sprawl: is unplanned, low-density housing and commercial development outside of cities, often with no real idea of where it is going or where it will stop. • Sprawl encouraged by • Post–World War II demand for consumer goods: cheap cars and gas • Housing boom with low mortgage rates • Highway Trust Fund
Characteristics of Sprawl • Excessive land consumption. • Low densities in comparison with older centers. • Lack of choice in ways to travel. • Fragmented open space, wide gaps in development, and a scattered appearance. • Lack of choice in housing types and prices. • Separation of uses into distinct areas. • Repetitive one-story development. • Commercial buildings surrounded by large parking areas. • Lack of public spaces and community centers.
Measuring Sprawl • Residential density • Neighborhood mix of homes, stores, and workplaces • Accessibility of the street networks • Strength of activity centers and downtowns • Visit, www.priceofsprawl.com
Factors That Contribute to Sprawl • Planning and Policy • Historically, there was little coordination of effort as to how cities should develop. • Large cities have a huge number of political jurisdictions, so coordination is difficult. • Zoning ordinances prohibit land-use mixing. • Ordinances specify minimum lot and house sizes. • Government subsidizes the development of decentralized cities. • Local governments pay some costs of extending services into new areas; costs are not passed on to builders.
Problems Associated with Unplanned Growth • Transportation • As cities grew, little thought was given to transportation corridors. • Establishment of new corridors stimulates growth in nearby areas, and the new corridors soon become inadequate. • Reliance on automobiles has required constant road building. • In Los Angeles, 70% of city’s surface area dedicated to automobiles. • The average person in the U.S. spends 9 hrs/week in an automobile.
Problems Associated with Unplanned Growth • Air Pollution • As traffic increases, so does air pollution. • A centralized, efficient public transportation system solves this problem, but it is difficult to achieve with a highly dispersed population. • Low Energy Efficiency • Automobiles are inefficient transportation. • Separation of homes and businesses requires additional driving. • Stop-and-go traffic patterns. • Single-family homes are less efficient than multifamily dwellings.
Problems Associated with Unplanned Growth • Loss of Sense of Community • In many areas, people do not routinely walk through their neighborhood, leaving them feeling isolated. • Death of the Central City • Currently less than 10% of people work in the central city. • There is less income to support public services. • Higher Infrastructure Costs • Extension of municipal services is more costly than supplying services to areas already in the city.
Problems Associated with Unplanned Growth • Loss of Open Space • Oftentimes open space planning is left out of development plans. • Loss of Farmland • Flat, well-drained land is ideal for both farmland and urban development. • Several states have established programs that provide protection to farmers who do not want to sell their land to developers. • These programs may require farmers to put their land in a conservation easement.
Problems Associated with Unplanned Growth • Water Pollution Problems • Large impervious surface areas lead to high runoff and potential flooding. • Floodplain Problems • Many cities are located on floodplains because they were originally established along waterways. • The flat land is attractive to developers but would be better put to use as open space or recreation. • Development increases economic losses. • Many communities have enacted floodplain zoning ordinances.
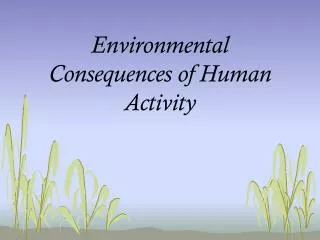
Environmental Impacts of Urban Sprawl: Simplify and Destabilize Habitats Photos by C. E. Adams
Impacts of Urban Sprawl: Quality of Life • Higher vehicle ownership and driving mileage • Greater risk of fatal accidents! • Lower rates of walking and lessened use of mass-transit facilities • No change in congestion delays (or they get worse) • Higher costs for municipal services • Higher incidence of obesity and high blood pressure
Indicators of Urban Decay • Economic and ethnic segregation • Eroding tax base • Loss of social services • Lowered property values • Higher property taxes • Deterioration of central city infrastructure
Urban Blight in Developing Countries • Slum communities • No utility services • No land ownership • Crime and disease are endemic • Expected to continue growing into middle of century • Continually overwhelmed by influx of rural immigrants • Severe problems just miles away in Haiti
Controlling Urban Sprawl: Smart Growth • “Smart Growth”: forces communities to purposely choose to develop in more environmentally sustainable ways.
Land-Use Planning Principles • Land-use planning is a process of evaluating the needs and wants of a population, the land characteristics and value, and various alternative solutions to land uses before changes are made. • A basic rule should be to make as few changes as possible. • When changes are needed: • Evaluate and record unique geological, geographic, and biologic features. • Preserve unique cultural or historical features. • Conserve open space and environmental features. • Recognize and calculate the cost of additional changes required to accommodate altered land use.
Land-Use Planning Principles • Plan for mixed uses in close proximity. • Plan for a variety of transportation options. • Set limits and require managed growth patterns with compact development. • Encourage development in areas with existing infrastructure. • Comprehensive toolbox of solutions for Florida: • http://www.cues.fau.edu/toolbox/
Special Urban Planning Issues • Urban Transportation Planning • Urban transportation planning usually involves four goals: • Conserve energy and land resources. • Provide efficient and inexpensive transportation, particularly to those who are unable to drive. • Provide efficient transportation opportunities to suburban residents. • Reduce urban pollution.
Special Urban Planning Issues • Mass transit in the U.S. is often underfunded and difficult to establish because: • It is only economical along heavily populated routes. • It is less convenient than the automobile. • It is extremely expensive to build / operate. • Existing examples are often crowded and uncomfortable. • The U.S. government encourages personal autos by financing highways, maintaining cheap energy policy, and not funding mass-transit projects (these are all hidden subsidies).
Special Urban Planning Issues Decline of mass transportation