Human Population Growth
Human Population Growth. Trends & Carrying Capacity. Humans as k-strategists. Humans have a small number of offspring They begin reproducing later in life They provide a great deal of care to their offspring This has been a very successful strategy for humans.


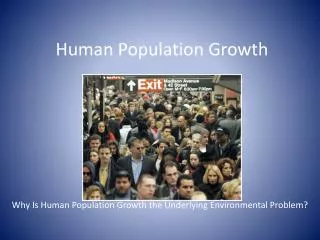
Human Population Growth
E N D
Presentation Transcript
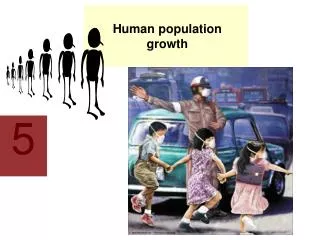
Human Population Growth Trends & Carrying Capacity
Humans as k-strategists • Humans have a small number of offspring • They begin reproducing later in life • They provide a great deal of care to their offspring • This has been a very successful strategy for humans • http://www.booksaboutthefuture.com/human-population-problems.htm
Demography http://envirosci.net/111/population/the_human_population.htm • The study of the statistics of human populations, including population size, density, distribution, movement and birth and death rates
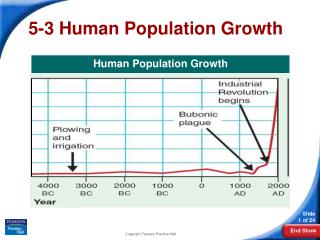
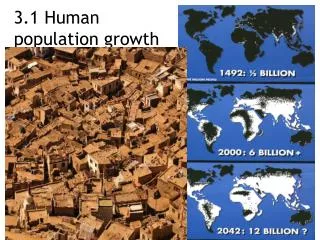
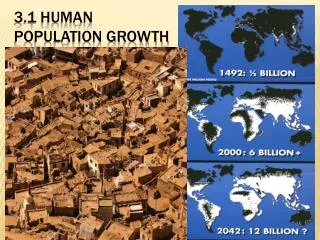
Trends in Human Population Growth • http://www.subdude-site.com/WebPages_Local/Blog/topics/environment/enviro_worldPopGrowth_charts.htm • Throughout most of our history (approx. 2 million yrs.) the human population size was stable and regulated by factors that affect other populations such as food availability, disease and predators • Then around 8000 BEC we took matters into our own hands… http://www.youtube.com/watch?v=Yocja_N5s1I
The Plague • After the agricultural revolution, the human population slowly increased until the bubonic plague from 1347 – 1350 killed an estimated one third of the European population • http://wsutoday.wsu.edu/pages/Publications.asp?Action=Detail&PublicationID=32128&PageID=21 • http://www.mirror.co.uk/news/world-news/man-developed-bubonic-plague-from-cat-1147350
Technological Factors • http://www.youtube.com/watch?v=zhL5DCizj5c • http://talonssephr.edublogs.org/2011/04/06/the-industrial-revolution-and-its-effect-on-upper-and-lower-canadians/ • A short time after the plague, the population started to grow exponentially This is due to a variety of technological factors such as: • Improved agricultural and domestication methods • Improved medicine • Improved shelter (for people and to store food)
Exponential Growth – Growth Rate • The growth rate has dramatically increased over the last 300 years • The birth rate has remained about the same (30 births /1000people/year), but the death rate has decreased from about 20 deaths/1000 people/year to only 12 deaths/1000 people/year • http://www.learner.org/courses/envsci/unit/text.php?unit=5&secNum=4
Exponential Growth – Growth Rate2 • Population in the world is currently growing at a rate of around 1.10% per year. The average population change is currently estimated at around 75 million per year. • Annual growth rate reached its peak in the late 1960s, when it was at 2% and above. The rate of increase has therefore almost halved since its peak of 2.19 percent, which was reached in 1963, to the current 1.15%. • The annual growth rate is currently declining and is projected to continue to decline in the coming years, but the pace of the future change is uncertain. Currently, it is estimated that it will become less than 1% by 2020 and less than 0.5% by 2050. • http://www.learner.org/courses/envsci/unit/text.php?unit=5&secNum=4 • http://www.worldometers.info/world-population/
Exponential Growth – Growth Rate3 • This means that world population will continue to grow in the 21st century, but at a slower rate compared to the recent past. World population has doubled (100% increase) in 40 years from 1959 (3 billion) to 1999 (6 billion). It is now estimated that it will take a further 42 years to increase by another 50%, to become 9 billion by 2042. • The latest United Nations projections indicate that world population will nearly stabilize at just above 10 billion persons after 2100.
Exponential Growth-Doubling Time *http://geography.about.com/od/obtainpopulationdata/a/worldpopulation.htm
Doubling Time In developing countries, such as many counties in Asia and Latin America, populations are growing much faster than those in developed countries such as Canada and England.
Population Pyramids • Are bar graphs that demographers use to assess a population’s potential for growth • It shows a percentage of males (usually shown on the left) and females (usually right) in different age categories (usually 5 year intervals) http://www.statcan.gc.ca/edu/power-pouvoir/ch1/examples-exemples/5214854-eng.htm
Population Pyramids2 • The shape of the pyramid is used to predict demographic trends in populations • http://withfriendship.com/user/mithunss/population-pyramid.php
Population Pyramid-Kenya • A triangular shape predicts a future of explosive growth because a large part of the population will enter their reproductive years at the same time (growth momentum) • It also shows that approximately half of all Kenyans are under the age of 20, indicating a decreased average lifespan • Kenya could double its population in a very short time http://www.prb.org/Articles/2012/kenya-family-planning.aspx
Population Pyramid-USA • A rectangular shape indicates a stable population • It shows that approximately 14% of Americans are under the age of 20, indicating a long lifespan • The USA has a much longer doubling time • http://pdsblogs.org/chargerapes513/tag/populations/
Population Pyramids- Other • These graphs can also be used to study subsets of a particular region http://www.migrationinformation.org/datahub/graphs/pyramid_8.shtml
Check Your learning:Describe the types of growth rates in the following countries • http://prolife.org.nz/2011/01/over-population-abortion/ • http://www.mcigeo.com/ • http://fistfulofeuros.net/afoe/the-french-rebound-continues-in-october-while-germany-moves-sideways • http://cconley.ca/2012/06/01/census-2011-ontario-population-pyramid/