Slide Note
0 likes | 4 Views
This presentation outlines the impact evaluation of SCE Demand Response Aggregator contracts, focusing on three DRAs: Hybrid Electric Building Technologies, Stem Energy, and Swell Energy. It includes methodologies for ex-post and ex-ante assessments, comparing load impacts, forecasted contract quantities, and achieved impacts. The analysis covers contract capacity, modeling approaches, results, and contract performance for August 2023.

E N D
Load Impact Evaluation: SCE Demand Response Aggregator Contracts Dan Hansen May 2023
Presentation Outline 1. 2. 3. 4. 5. 6. Resource Description Ex-post Methodology Ex-post Load Impacts Ex-ante Methodology Ex-ante Load Impacts Comparison of Prior Ex-ante and Current Ex-post Load Impacts 2
1. Resource Description • Three Demand Response Aggregators (DRAs) had active contracts during 2022: • Hybrid Electric Building Technologies (Hybrid) • Stem Energy (Stem) • Swell Energy (Swell) • Hybrid and Stem enrolled commercial and industrial customers to provide demand response within SCE’s service territory; Swell enrolled residential and small commercial customers • DRAs nominate customers on a monthly basis • SCE dispatched the contracts according to the associated terms • DRA is responsible for meeting the contract obligations 3
1. Resource Description: Maximum Capacity for 2022 DRA Contracts Total Contract Capacity (MW) Month Hybrid Stem Swell Total 8 to 10 a.m. 50 0 0 50 10 a.m. to 4 p.m. 50 20 0 70 4 to 6 p.m. 50 20 0.1 70.1 6 to 9 p.m. 33.5 20 0.1 53.6 4
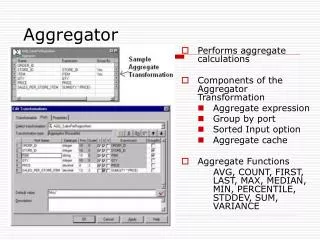
2. Ex-post Methodology • Estimated customer-specific regression models with the customer’s hourly usage as the dependent variable • Models are used to simulate reference loads that would have occurred in the absence events • The explanatory variables include: • Temperatures, expressed in several ways (e.g., current hour, average daily, maximum daily) • Hour of day • Day of week • Month of year • A morning load variable (average load from midnight to 10 a.m., except for customers with early event hours) 5
2. Ex-post Methodology (2) • October 2021 through September 2022 data included in the model • Exclude event hours plus at least 3 hours following the event • If the event starts at 5 p.m. or later, the rest of the day is excluded • Needed to include some event-day data to improve estimates for contracts with a high frequency of events • Exclude data prior to the customer’s first nominated month, which ensures that storage is in place (if applicable) • Model validation • Estimated a common specification excluding ~15% of the data (randomly selected non-event days) • Compared predicted and observed values on withheld days and adjusted the customer’s regression specification as needed • Estimated load impact = the model’s predicted load for the event hour minus the observed load 6
3. Ex-post Results Average Event Hour with Full Dispatch Load Impact = our estimate of the difference between observed loads and the loads that would have occurred in the absence of the event ❑ % Impact = Load Impact / Reference Load ❑ % of Contract Amount = Load Impact / Contract Amount ❑ Includes only event hours with all resources dispatched within a contract ❑ 7
3. Ex-post Results August 17, 2022 Hourly Load Impacts Dark blue shading = Full dispatch Light blue = All but 1 dispatch ID called Dark green = All Hybrid or all Stem called Light green = One Hybrid ID called Red shading = Contract quantities 8
4. Ex-ante Methodology • SCE provided a forecast of monthly capacity commitments by contract • Replaces the enrollment forecast typically used in a load impact study • Simulate customer-specific reference loads for all required scenarios (by month and weather scenario) • Same as ex-post regression model but omitting the morning load variable 9
4. Ex-ante Methodology: Contracts in the Ex-Post Study • Ex-ante load impacts are a straightforward translation of the ex-post estimates • No weather effect on load impacts, so no statistical modeling is needed • Forecast is drawn from corresponding observed hours, e.g., HE 17 ex-post impacts are used to forecast HE 17 ex-ante impacts • Hourly forecast impacts are built up from dispatch ID-level estimates (allows us to use all events and not just full-dispatch events) • Contracts have a maximum 4-hour event duration, whereas the Resource Adequacy window is 5 hours long • Simulate all 5 hours to reflect the resource’s potential in each hour of the RA window • Forecast contract quantities matched ex-post contract quantities, so no adjustment was needed for that 10
4. Ex-ante Methodology: Contracts NOT in the Ex-Post Study • For contracts not in the ex-post study, we have no customer load data or historical performance upon which to base the ex-ante forecast • We follow the assumption from the previous evaluation, applying an assumed percentage to the contract value to forecast the load impacts that will be provided 11
5. Ex-ante Load Impacts: Forecast Contract Quantities (MW) 12
5. Ex-ante Load Impacts: Average August RA Window Impacts (MW) Contract Achievement in August 2023 = 94.5% 13
5. Ex-ante Load Impacts: August 2023 SCE 1-in-2 Impacts (MW) 14
6. Comparison of Ex-Ante and Ex-Post Load Impacts • In the table below, we compare the forecast of PY2022 load impacts produced during the PY2021 evaluation (“Previous Ex-Ante”) to the ex-post load impacts estimated as part of this study (“Current Ex-Post”) • The forecasting error at the program level was 0.2 MW, though with slightly higher contract achievement in ex-post vs. the ex-ante forecast • One contract was somewhat over-forecast while another was under-forecast due to ramping-up issues • Neither issue caused us to modify our methodology Current Ex-Post (MW) 59.0 61.0 Previous Ex-Ante (MW) 58.8 63.1 Result Type Load Impact Contract Quantity 15
Questions? Contact Dan Hansen Christensen Associates Energy Consulting Madison, Wisconsin • dghansen@CAEnergy.com • (608)231-2266 16