Download
1 / 25
250 likes | 265 Views
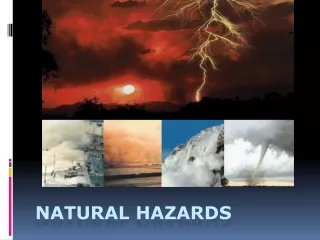
Southern California Natural Hazards Risk Assessment. By: Aaron Mielke Allison Smith Emily Oleksiuk Tonia Roddick. Problem:. Where are the areas of high hazard from natural disasters? Are urban areas located in high hazard areas?.

E N D
Southern California Natural Hazards Risk Assessment By: Aaron Mielke Allison Smith Emily Oleksiuk Tonia Roddick
Problem: • Where are the areas of high hazard from natural disasters? • Are urban areas located in high hazard areas?
Earthquakes, Landslides, and Wildfire in Southern California • Contributing Factors: geology, climate, and human • use of landscape and resources
Earthquakes, Landslides, and Wildfire in Southern California • Contributing Factors: geology, climate, and human • use of landscape and resources • How severe are these hazards and what are their • effects?
Earthquakes, Landslides, and Wildfire in Southern California • Contributing Factors: geology, climate, and human • use of landscape and resources • How severe are these hazards and what are their • effects? • Goal of project: Determine hazardous areas in • Southern California and urban areas at high or • very high risk
Earthquakes, Landslides, and Wildfire in Southern California • Contributing Factors: geology, climate, and human • use of landscape and resources • How significant are these hazards and why are • they a problem? • Goal of project: Determine high risk areas in • Southern California based on these hazards and • urban areas at high or very high risk • Applications of results: insurance companies, • land developers, and disaster preparedness
Earthquakes, Landslides, and Wildfire in Southern California Study Area:Southern California 10 Southern Counties 57,000 Square Miles San Luis Obispo Kern San Bernardino Santa Barbara Los Angeles Ventura Riverside Orange San Diego Imperial
Solving the Problem: Determining Fire Hazard • Data Layers • Fire Rotation Rank townships • Fuel Ranking Rank townships
Calculating Fire Hazard Overlay and Rank
Solving the Problem: Determining Earthquake Hazard • Data Layers • Fault Lines Townships ranked by distance from fault • Historical Earthquakes Townships ranked by EQ/miles^2 • Ground Acceleration Townships ranked by area weighted ground acceleration value
Calculating Hazard from Fault lines Buffer/rank Overlay Ranking (Distance from faults km) 0 >25km 1 (20-25km) 2 (15-20km) 3 (10-15km) 4 <10km
Calculating Hazard from Past Earthquakes Overlay Rank Ranking (Earthquakes/mile^2) 0 0 1 (0-0.028) 2 (0.028-0.069) 3 (0.069-0.2) 4 >0.2
Calculating Hazard from Ground Acceleration Overlay Rank Ranking (Ground Acceleration) (percent of gravity) 0 (0-13.6) 1 (13.6-22.8) 2 (22.8-34.8) 3 (34.8-54.8) 4 >54.8
Calculating Overall Earthquake Hazard Faults Earthquake Ground Overall
Solving the Problem: Determining Landslide Hazard • Data Layers • Precipitation Townships ranked by range of annual rainfall • Geology Townships ranked by hardness of bedrock • Slope Townships ranked by steepness of slope
Calculating Hazard from Precipitation Overlay Rank Ranking (Precipitation inches) 0 <2.5 1 (2.5-7.6) 2 (7.6-12.8) 3 (12.8-18.8) 4 >18.8
Calculating Hazard from Geology Overlay Rank Ranking (Geology) 0 (0-1.2) 1 (1.2-3.1) 2 (3.1-4.1) 3 (4.1-4.6) 4 >4.6
Calculating Hazard from Slope Overlay Rank
Calculating Overall Landslide Hazard Precipitation Geology Slope Overall
Results: • Hazard Maps: • Fire Hazard • Earthquake Hazard • Landslide Hazard • Overall Hazard • Urban Map • Numbers: • Percent of area classified as urban • Percent of population in urban areas • Percent of study area classified as high or very high hazard • Percent of urban area in high or very high hazard areas • Percent of population in high hazard areas
Hazard Maps Fire Hazard Earthquake Hazard Landslide Hazard Overall Hazard
Urban Areas in Southern California Los Angeles San Diego
Urban areas overlayed on Hazard Map Urban Areas • Study area: • 57,115 square miles • 20,637,304 people • Urban Areas: 500 people/square mile or more • 3,158 square miles - 5.5% of Study area • 20,065,398 people - 97.2% of Study area population • High or Very High Hazard Areas: • 25,500 square miles - 42% of Study area • Urban Areas at High or Very High Risk: • 2011 square miles - 63% of urban areas are in high or very high hazard areas • - 3.4% of Study area is Urban and high or very high hazard area • 12,414,461 people - 62% of urban area population • - 60% of Study area population
Improvements: Fire: Components of fire were averaged—a weighted average (as was done with the earthquake components) would probably be more accurate Earthquake: Faults were all buffered equally—it would be more accurate to put a heavier weight on faults that are more active than those that are less active. We used a straight count for the number of earthquakes per township—it would be more accurate to weight this count by magnitude Landslide: We used average annual precipitation in the landslide section— precipitation intensity data would have been useful Urban: We determined the threat to urban areas in terms of population density—this does not take into account expensive structures in less populated areas