Download
1 / 41
410 likes | 514 Views
Dive into the world of ocean currents and extreme events with a focus on the median energy flux and non-tidal current speed. Uncover the truth behind cyclonic eddies and sea level anomalies, exploring both historical data and real-time observations. Delve into the discussion on quality control and the importance of considering extreme values in data analysis for operational oceanography. Discover the insights gained from tracking East Australian Current warm-core eddies and the potential link to La Nina events. Join us on a journey through data analysis and quality control methodologies, aiming to improve the accuracy and reliability of real-time oceanographic studies.

E N D
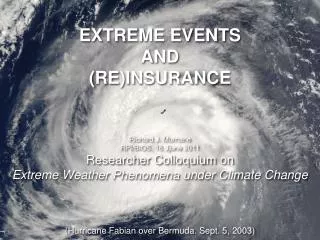
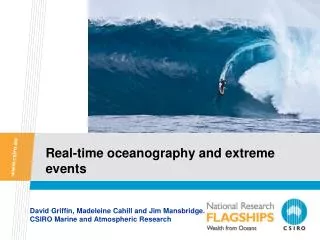
Real-time oceanography and extreme events David Griffin, Madeleine Cahill and Jim Mansbridge. CSIRO Marine and Atmospheric Research
Median energy flux of ocean currents 0 Median non-tidal current speed 0.8 (m/s) Insert presentation title
Median energy flux of ocean currents 0 Median non-tidal current speed 0.8 (m/s) Insert presentation title
CyclonicEddy (Low sealevel) Is it real? Yes, see drifter. Is it extraordinary? Lets look at some history
Maximum (in 1994-2011) gridded altimetric (+ filtered tidegauge) sea level anomaly: +1m SSHA -1m wide range: 0.3m to 1.1m Extraordinarinesscannot be judged from a single SSHA map.
99th percentile anomaly (exceeded 1% of time) NB: 30% less than 100th percentile 0.2m 0.7m +1m SSHA -1m
1st percentile anomaly (exceeded 99% of time) +1m SSHA -1m -0.7m
Minimum elevation (0 %-ile) is 30% more extreme than 1st %-ile -1m Insert presentation title
Maximum anomaly map again.highest highs are south of the lowest lows +1m SSHA -1m Low low High high
Median elevation (50th percentile)near zero – i.e. distribution is fairly symmetric +1m SSHA -1m
CyclonicEddy (Low sealevel) Is it real? Yes, see drifter. Is it extraordinary? Letsuse that history
16 Jan 2011: Many extreme highs and lows 1.5m/s Insert presentation title
Back 4 days (to 12 Jan) Insert presentation title
Back 4 days (to 8 Jan) Insert presentation title
Back 4 days (to 4 Jan) Insert presentation title
Back 4 days (to 31 Dec) Insert presentation title
Back 4 days (to 27 Dec) Insert presentation title
Back 4 days (to 23 Dec) Insert presentation title
That high sea level all along the coast was not a ‘storm surge’ • Coastal sea level was very high. Anomaly of nearshore current was zero. Odd situation – still needs investigation. • Lets now go back to 16 Jan then step forward.
vanishing growing Insert presentation title
So, that’s how a record-breaking East Australian Current warm-core eddy was born • Existence of strong coastal currents obvious to all mariners • What is the link to the extreme La Nina? • The area-average current speed usually has a January maximum off SE Aust: SE Aust 2011 not extreme
Back to the question of quality control: • New approach (for us) to real-time QC: • Reject data by comparing with historic extrema • Eg: at each point in space use only 1.5*min < SSHA <1.5*max • Much more discriminating than spatially invariant limits • But: how do the stats of track data compare with stats of maps?
A: very closely: Min of tracks~= min of maps. Only 1 bad Envisat track in RADS at present: SSHA = -2m (=3*minimum) not edited by standard RADS editing
Max values: Same result
Discussion • It is tempting not to focus on the extreme values in a data set, or to think much about the shape of the distribution function, and how it varies in space. • Extreme values in Near-Real-Time data are often errors: indeed, some erroneous NRT maps were found during the production of this talk. • By definition, the genuine extreme values are rare, and pose a challenge to automatic quality control. • But it is essential not to be lazy here. (Modellers might be reluctant to assimilate unseen values into an operational model). • For operational oceanography to become a reality, we must build systems that do not fail when they are most needed .
Thankyou • We thank the many people and agencies (ESA, EuMetSat, CNES, NASA, NOAA, Argo, Drifter program) for the data shown here. • We look forward to including Altika in similar analyses • …and to getting CryoSat2 data closer to real time • Our URL again: imos.aodn.org.au/oceancurrent