Download
1 / 40
400 likes | 635 Views
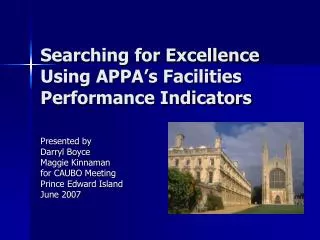
Searching for Excellence Using APPA’s Facilities Performance Indicators. Presented by Darryl Boyce Maggie Kinnaman for CAUBO Meeting Prince Edward Island June 2007 . Higher Education . “Education is not about filling a pail, it’s about lighting a fire.” William Butler Yeats.

E N D
Searching for Excellence Using APPA’s Facilities Performance Indicators Presented by Darryl Boyce Maggie Kinnaman for CAUBO Meeting Prince Edward Island June 2007
Higher Education • “Education is not about filling a pail, it’s about lighting a fire.” William Butler Yeats
Objectives of Higher Education • Socialization to Maturation • Training to Learning • Research to Discovery • Public Service to Engagement • Credentials to Competence • Recognition to Credibility
Why Improve? • What pressures? • What new and future challenges? • What opportunities? • What is the cost of not improving? • What personal drivers?
Major Forces Impacting Higher Education • Accountability • Educational delivery no longer time/place sensitive • Lifelong learning • Diminishing resources • Competition requires market focus • Entrepreneurial skills necessary • Scarce energy
Capital Asset Realities • Construction • Maintenance • Renewal • Demolition
Someone once said, “The mark of insanity is doing the same thing over and over again while expecting a different result.”
Facilities Management’s Role • Ensure that the buildings and infrastructure are a strategic enabler for the business of higher education • Stewardship role for the largest capital asset on campus, buildings and infrastructure • Facilities Management is typically the largest Administrative Department on campus so it is ripe for downsizing • Facilities must be able to tell their story to decision makers • We must be accountable for the assets entrusted to us
What are Facilities Performance Indicators (FPI)? • Merges CCAS and SAM • FPI creates a powerful tool for achieving organizational excellence through continuous improvement • Organization’s financial performance • Effectiveness of its primary processes • Readiness of employees to embrace the future • Ability to delight customers
Why Use FPI? • Self-Assessment • Self-Improvement • Peer comparison • Benchmarking • Your Roadmap to Future Excellence
In the words of the great hockey player Wayne Gretzky, “I skate to where the puck is going to be, not where it has been.”
Components of FPI • Balanced Scorecard • Quantitative Measurements and Indicators • Qualitative Criteria Captured in the Performance Levels
Effective Results Customers Employees Financial Internal Strategic Planning Leadership How It All Fits Together
Efficiency Versus Effectiveness • Efficiency is getting results • You can do that if you pay attention to one perspective • Effectiveness is getting results time and time again • You can only get by paying attention to all four perspectives
Financial Perspective • How do we look to resource providers? • Reflects organization’s financial integrity • Demonstrates stewardship responsibility • Capital and financial resources • Preservation of physical assets • Linked to the other perspectives through the relationships between cost and the results
Internal Process Perspective • At what must we excel? • Evaluation of delivery of primary services • Administration • Operations and maintenance • Energy and utilities • Planning, design and construction • Emphasis on improvements and measuring results
Innovation and Learning • How can we sustain excellence over time? • Creating a high performance workplace and a learning organization • Considers how the organization enables and encourages employees to contribute effectively • Training – leadership and knowledge sharing • Employee well being and satisfaction
Customer Perspective • How do our customers see us? • Considers relationships with customers • Measures customer satisfaction and performance of services • Categories • Types of surveys • Primary customer groups • Primary services
Strategic Financial Measures • Facility Operating CRV Index ($/CRV) • Facility Operating GSF Index ($/GSF) • Facility Operating GIE Index ($/GIE) • Capital Renewal Index ($CR+Adapt/CRV) • Facilities Condition Index ($DM/CRV) • Needs Index ($DM+CR+Adapt/CRV)
Facility Operating/CRV Index • Annual Facility Operating expenditures ($) Divided by Current Replacement Value (CRV) • Level of funding provided for the stewardship responsibility of the institution’s annual facilities operating expenditures
Facility Operating/GSF Index • Annual Facility Operating Expenditures ($) Divided By Gross Square Feet (GSF) • Level of funding provided for the stewardship responsibility of the institution’s educational and general capital assets
Facility Operating/GIE Index • Annual Facility Operating Expenditures ($) Divided by Gross Institutional Expenditures (GIE) • Level of funding provided for the stewardship responsibility of the institution’s educational and general capital assets
Capital Renewal Index • Annual Capital Renewal and Renovation/Modernization Expenditures ($) Divided By Current Replacement Value (CRV) • Level of funding expended in addressing identified capital renewal and renovation/modernization needs
Facilities Condition Index (FCI) • Deferred Maintenance Deficiencies ($) Divided By Current Replacement Value (CRV) • Comparative indicator of the relative condition of facilities
Needs Index • Capital Renewal and Deferred Maintenance Backlog plus Renovation/Modernization Need ($) Divided by Current Replacement Value (CRV) • Overall indicator of campus condition. It is influenced by resource availability and utilization
Internal Process Perspective • Cycle Time (Time to complete) • Average Age (Average age of active work orders) • Backlog (Staff Hrs/FTE Hrs) • Energy Usage (BTU/GSF) • Estimating Index ($Actual/$Estimate) • Project Soft Costs Index ($Soft/Total)
Innovation and Learning • Employee Climate Survey • Employee Focus Groups • Investment in Training • Quality work incentives • Awards and Recognition • Job Skills
Customer Perspective • Customer Surveys • Customer Focus Groups at different levels of the organization • WEB resources and tools • Participation in Academic briefings
Performance Levels • Level 5 Platinum • Level 4 Gold • Level 3 Silver • Level 2 Bronze • Level 1 Copper
Level 1 - Copper • No systematic approach • Only anecdotal information
Level 2 – Bronze • Beginnings of a systematic program • Major gaps exist • Early stages of improvement orientation • Trends of some improvement
Level 3 – Silver • Sound systematic program • Fact-based improvement for most areas • Emphasis on improvement • Improvements in most areas • No adverse trends • Comparisons – good to very good
Level 4 - Gold • Sound program with refinements • Cycles of improvement in many to most • All primary areas included • Sustained performance trends • Benchmarking • Results show leadership in performance
Level 5 – Platinum (Stretch) • Program accomplishes all objectives • Fully deployed for all primary areas • Emphasis on refinement • Cycles of improvement – Mature program • Excellence sustained over several years • Benchmarking with outside industries
Why FPI? • Strategic Tool • Helps to assess where you are • Describes where you can go • Outlines the strategies and action necessary You decide how far to go Tailor model for your specific needs
Sharing FPI Data • Internal • FM employees • FM contractors • FM administrators • Within the institution • Planners • Financial Officers • Academicians • Researchers • Externally • Legislatures • Other institutions
Why is Sharing Important? • Remember the capital asset realities? • They cannot be solved by FM working in isolation • FM must educate the institution • Engage the institution • Create partnerships • Work together to create a strategy to address the capital asset realities
Your Stairway to Excellence • Understand the context within which you operate • Create partnerships with your environment • Identify your measurements of success • Strive for balance using four perspectives • Measure at all levels of the organization • Share the results • Set the bar higher • Identify new strategies • Educate, engage and brief your partners on how you’re doing • Do it all over again • Don’t give up!!!!
“Knowing is not enough; we must apply. Willing is not enough; we must do.” Johann Wolfgang von Goethe