Download
1 / 19
190 likes | 640 Views
Attribute Accuracy. February 15, 2006 Geog 458: Map Sources and Errors. Please note overlaps between positional accuracy and attribute accuracy Accuracy = discrepancy between measured value and true value Location value or Attribute value Components of errors: bias, precision, RMSE

E N D
Attribute Accuracy February 15, 2006 Geog 458: Map Sources and Errors
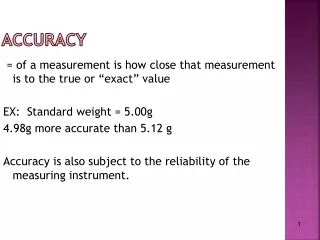
Please note overlaps between positional accuracy and attribute accuracy • Accuracy = discrepancy between measured value and true value • Location value or Attribute value • Components of errors: bias, precision, RMSE • Level of testing • External validation: comparison to source and independent source of higher accuracy
True value?Source of higher accuracy? • True value is considered to come from some comparable measurement known to be of higher accuracy • Need to agree on rules that can identify a source as being of higher accuracy (or largely reference data) • Greater level of detail (larger scale) • Greater care and expense in data collection, or an instrument known to be of higher accuracy • More recent measurement • Direct observation on the ground rather than from space
Well-defined point • It is considered to have a sharp identity, less ambiguous, more likely to be accurate in position, should be unambiguous in making comparison between reference and test point • Four tic marks in quadrangle • Road intersections • Survey points (bench mark, geodetic network)
Outlines • Testing attribute accuracy • What are attribute accuracy measures I can use? • Sampling schemes • Too many features, how wise can I sample from them? • Documenting attribute accuracy measures • Which should be included in my testing report?
Testing attribute accuracy: level of measurement • You’re testing elevation in DEM • You’re testing land use type in LU/LC Your test data says 100 feet Your reference data says 110 feet Your test data says it’s residential Your reference data says it’s commercial Would they use the same accuracy measures? test point
Attribute accuracy measures • If the tested attribute is interval/ratio, use RMSE • This time you don’t measure the distance, you measure the difference between measured value and true value • If the tested attribute is nominal, use Misclassification matrix (aka confusion matrix) • Since you can’t measure “closeness to true values” in such scale of measure • You can use Percent correctly classified (or PCC) = diagonal total / grand total; crude overall measure of accuracy
RMSE: procedure • Choose test data and reference data • Select a sample of locations > 20 • For each pair, calculate the discrepancy between test value and reference value • Obtain RMSE • Report RMSE*c given confidence level (c is dependent on confidence level upon error distribution)
RMSE: etc. • The “true” value can be obtained by field check • When you go out, keep unique IDs for each feature • The “true” value can be obtained from better existing data if any • You can label the same IDs by superimposing the reference data over the test data • Then join two tables through a common identifier • Then do some calculation in the joined table
Confusion matrix: procedure • Choose test data and reference data • Select a sample of locations • Compare the class assigned to each location in test data to reference data • Tabulate correct/incorrect classification • Column defines classes in reference data • Row define classes in test data • Report percent correctly classified and other accuracy measures (see next slides)
More on confusion matrix • Kappa index • PCC adjusted to random error • A certain number of correct classifications will occur by chance (=a) • [diagonal total – a] / [grand total – a] PCC = dt / gt where dt = diagonal total and gt = grand total Kappa index = (dt – a) / (gt – a) where a = [ sum of (row total * column total) ] / gt
More on confusion matrix • Error of omission of class i • When a point’s class in the reference data (or on the ground) is incorrectly recorded in the test data • Column sum of i – diagonal cell • Error of commission of class i • When the class recorded in the test data does not exist in the reference data (or on the ground) • Row sum of i – diagonal cell
More on confusion matrix • Producer’s accuracy of class i • probability that feature with true class i will appear in the test data • Diagonal cell / the summation over all rows for column i • Consumer’s accuracy of class i • probability that feature with apparent class i will be truly class i • Diagonal cell / the summation over all columns for row i
Confusion matrix What is Percent correctly classified? What is Kappa index from this confusion matrix? What is an error of omission or commission for the class A? What is producer or consumer’s accuracy for the class A? Column: class in the reference data Row: class in the test data
Confusion matrix: etc. • Where is reference data? • Any equivalent data set out there? • How do I assure if it’s a source of higher accuracy? • See metadata or ask point of contact • What if I can’t find reliable reference data? • Ground check (most likely!) • How do I select sample points? • Well, what do you think? Go to the next slides
population sample Sampling schemes • Random sampling • arbitrarily selected points • Systematic sampling • use fishnet (gridded)? • But what if features are not uniformly distributed like grid? Is the systematic sampling a good idea still then? • Stratified sampling • Sample is selected such that a certain characteristic can be included in a representative manner • For example, total population 1000 if you would like to sample 100 from them with equal weight on male and female, you should sample 50 from male and 50 from female given population
Combining sampling schemes • Example of random stratified sampling • Your data (let’s say land use type data) has 25% class A, 10% class B, and 40% class C, 25% class D • Make sure your sample include 25% from class A, and so on given population • Then select random points within classes stratified already
Sampling scheme • Best sampling scheme can be devised only when you think through how values are measured • Area the measurement of attributes attached to each data same? • DEM is measured from a continuous field (interpolation of values measured at station) • Land use map is measured from • Choropleth map comes from the derivation of population count within artificial unit • Busstop data is the actual location • River network is the generalized line from area-class map
Documenting accuracy measures • SDTS • If the attribute is measured in numerical scale, follow the procedures described in positional accuracy section • Otherwise • 4.3.1 Deductive estimate • Guess based on experience • The basis for the deduction must be explained • I think this data is good because …. • 4.3.2 Tests based on independent point samples • Misclassification matrix must be reported • The sampling procedure and the location of sample pointsmust be described • 4.3.3 Tests based on polygon overlay • The relationship between the two maps (test and reference) must be explained