Download

1 / 17
170 likes | 407 Views
Similarity Measures for Protein Binding Sites based on Fuzzy Histogram Comparison. Thomas Fober Eyke Hüllermeier Knowledge Engineering & Bioinformatics Group Department of Mathematics and Computer Science Marburg University, Germany.

E N D
Similarity Measures for Protein Binding Sitesbased on Fuzzy Histogram Comparison Thomas FoberEykeHüllermeier Knowledge Engineering & Bioinformatics Group Department of Mathematics and Computer Science Marburg University, Germany World Congress on Computational Intelligence, Barcelona, 21.07.2010
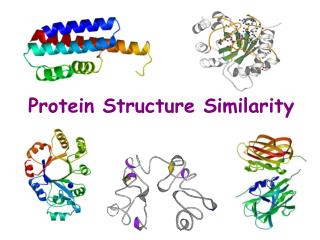
Protein Binding Sites • protein consists of amino acids • small cavities on the surface of a protein • small molecules can bind to these sites and cause a reaction of the protein • inhibit binding site or cause a reaction of the protein • no sequence or fold information • model: 7 physico-chemical properties defined by certain amino acids • abstraction: summarize patch into a spacial point( pseudocenter)
Applications • cross reactivities • binding site of target is known • search for proteins with similarbinding site • these proteins may also be influenced by ligand • prediction of the function • protein with unknown function but known structure • searchfor proteins with known function and similarbinding site • goal: find a similarity measure between protein binding sites • how to store / represent a protein binding site • how to define a similarity measure on a certain representation
Existing Approaches Point-cloudbased • labeled point cloud superposition • geometric hashing • Hausdorff distance Graph based • graph isomorphism • subgraph isomorphism • maximum common subgraph • minimum common supergraph • graph kernels • random walk • shortest path • graph edit distance • iterative approaches • quadratic programming • evolutionary algorithms
Cavbase • data base containing protein binding sites • 61,516 protein structures used to extract • 248,686 protein binding sites for large scale studies such approaches are not feasible
Histogram Representation I • binding sites consist of a set of pseudo-centers and a set of distances between them two distributions two histograms • first histogram represents distances • use set of bins • h(b) is the percentage of distances whose length are in the interval [b – 1, b[ • second histogram to represent pseudocenters • use bins and count for each type of pseudocenter its relative number of occurrences
Histogram Representation I (2) 3 1.5 0.8 2 0.9 0.6 1 red green blue 4 1 2 3
Histogram Representation II • considering pseudocenters and distances separately comes with a high loss of information • instead by two represent a protein binding site by 28 histograms • consider sets of all distances between pseudocenters of type i and j • calculate for each a histogram as described in (I) • normalize histograms to give all of them the same weight • advantage here: pseudocenters, their type, and distances are combined
Histogram Representation II(2) 1 2 3 1 2 3 1.5 0.8 0.9 0.6 3 1 2 3 1 2 3 1 2 3 1 2
Calculation of Similarity ... ... () ...
DistanceMeasures on Histrograms • bin-by-bin measures • Minkowski distance: • histogram intersection: • χ2 , Kullback-Leibler divergence, ... • cross-bin measures • quadratic form distance: whereand aij gives the similarity between bin i and j
DistanceMeasures on Histrograms (2) • distances based on cummulative distributions • match distance: • Kolmogorov-Smirnov distance: • earth-movers distance:
Fuzzy Histograms • problem of discontinuity is known for histograms • 2.99 belongs to bin [2, 3[ whereas 3.0 belongs to bin [3, 4[ • 2.1 and 2.9 belong to bin [2, 3[ • use triangular fuzzy sets with core {b} and support ]b – 1, b + 1[ • replace for fuzzy histograms counts by sigma-counts newdistance: 2.9 ... 2 3 ... ... ... 1 6 7 8 9 1 2 3 4 5
Experiment • classification of a two-class data set • the higher the classification rates, the better the similarity measure • ATP/NADH data set contains 355 protein binding sites • 214 bind NADH substrates • 141 bind ATP substrates • test procedure: • leave-one-out cross-validation • k-NN classifier
Conclusions • histograms can be used to represent a protein binding site in a simple way • loss of information • still enough information to retrieve meaningful similarity values • runtime much smaller in comparison to approaches used so far (on NADH/ATP dataset factor of about 800) • cross bin measures try to solve the problem of discontinuity on bin-boundaries • fuzzy histograms achieve the highest classification rate

![[Image Similarity Based on Histogram]](https://cdn0.slideserve.com/1309335/image-similarity-based-on-histogram-dt.jpg)


![[Image Similarity Based on Histogram]](https://cdn5.slideserve.com/9279474/image-similarity-based-on-histogram-dt.jpg)