Download
1 / 1
10 likes | 58 Views
Axis Direct presents daily derivatives report presenting recommendations based on technical analysis. For trading in derivatives visit https://simplehai.axisdirect.in/offerings/products/derivatives<br>https://simplehai.axisdirect.in/share-stock-prices/nse/Tata-Consultancy-Services-Ltd-5400<br>https://simplehai.axisdirect.in/share-stock-prices/nse/Lupin-Ltd-3026

E N D
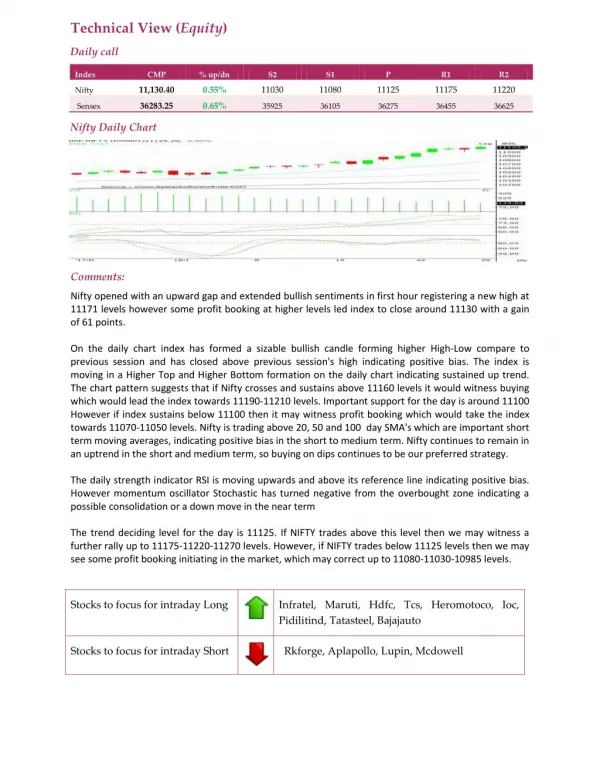
Technical View (Equity) Daily call Index CMP % up/dn S2 S1 P R1 R2 11,130.40 0.55% 11030 11080 11125 11175 11220 Nifty 36283.25 0.65% Sensex 35925 36105 36275 36455 36625 Nifty Daily Chart Comments: Nifty opened with an upward gap and extended bullish sentiments in first hour registering a new high at 11171 levels however some profit booking at higher levels led index to close around 11130 with a gain of 61 points. On the daily chart index has formed a sizable bullish candle forming higher High-Low compare to previous session and has closed above previous session's high indicating positive bias. The index is moving in a Higher Top and Higher Bottom formation on the daily chart indicating sustained up trend. The chart pattern suggests that if Nifty crosses and sustains above 11160 levels it would witness buying which would lead the index towards 11190-11210 levels. Important support for the day is around 11100 However if index sustains below 11100 then it may witness profit booking which would take the index towards 11070-11050 levels. Nifty is trading above 20, 50 and 100 day SMA's which are important short term moving averages, indicating positive bias in the short to medium term. Nifty continues to remain in an uptrend in the short and medium term, so buying on dips continues to be our preferred strategy. The daily strength indicator RSI is moving upwards and above its reference line indicating positive bias. However momentum oscillator Stochastic has turned negative from the overbought zone indicating a possible consolidation or a down move in the near term The trend deciding level for the day is 11125. If NIFTY trades above this level then we may witness a further rally up to 11175-11220-11270 levels. However, if NIFTY trades below 11125 levels then we may see some profit booking initiating in the market, which may correct up to 11080-11030-10985 levels. Stocks to focus for intraday Long Infratel, Maruti, Hdfc, Tcs, Heromotoco, Ioc, Pidilitind, Tatasteel, Bajajauto Stocks to focus for intraday Short Rkforge, Aplapollo, Lupin, Mcdowell