Download
1 / 1
10 likes | 28 Views
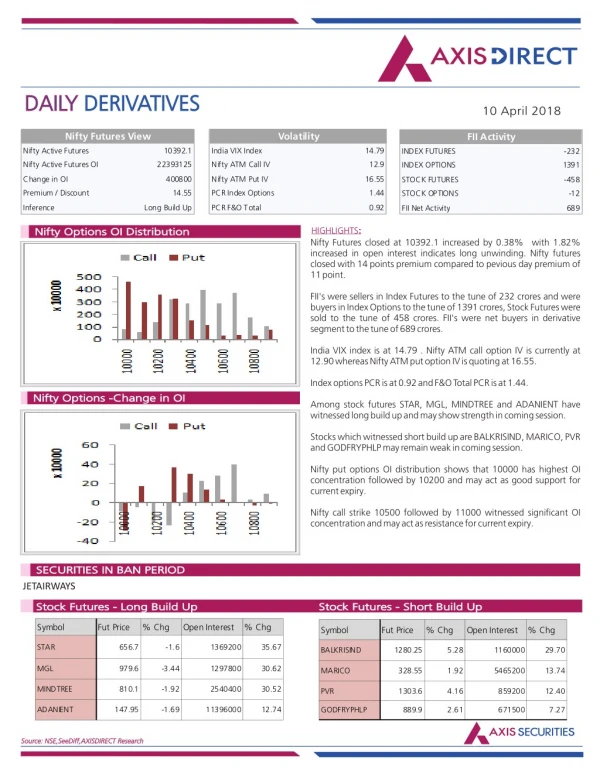
Axis Direct presents daily derivatives report presenting recommendations based on technical analysis. For trading in derivatives visit https://simplehai.axisdirect.in/offerings/products/derivatives<br>https://simplehai.axisdirect.in/share-stock-prices/nse/Cipla-Ltd-114<br>

E N D
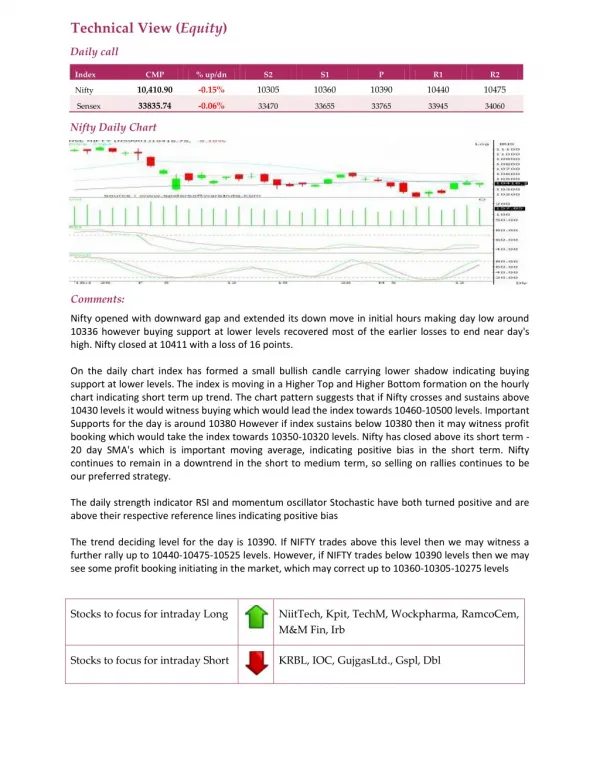
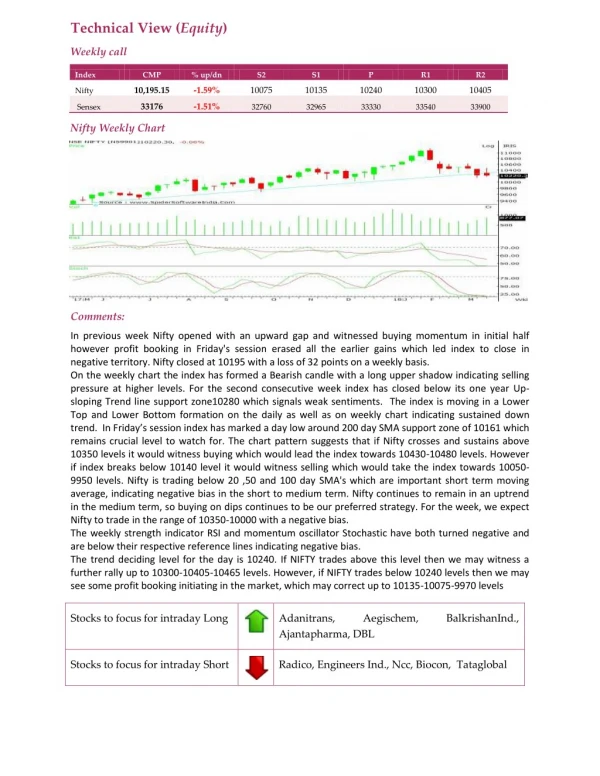
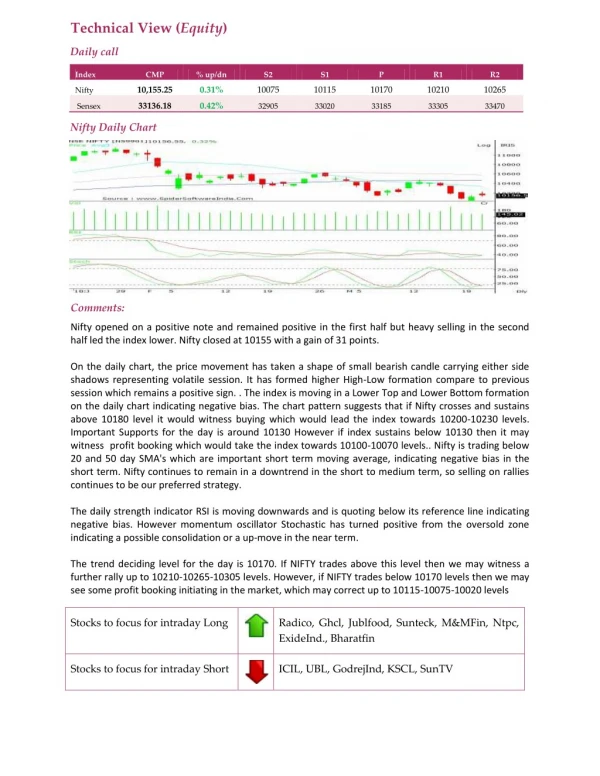
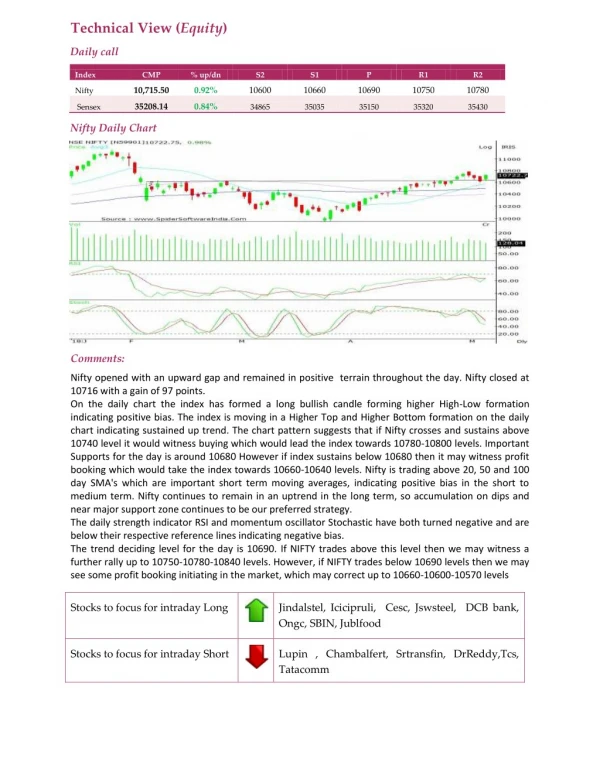
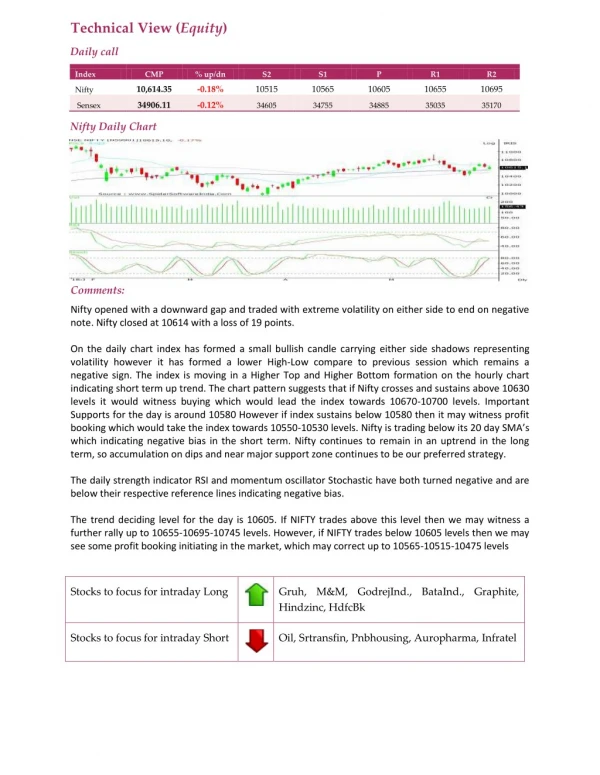
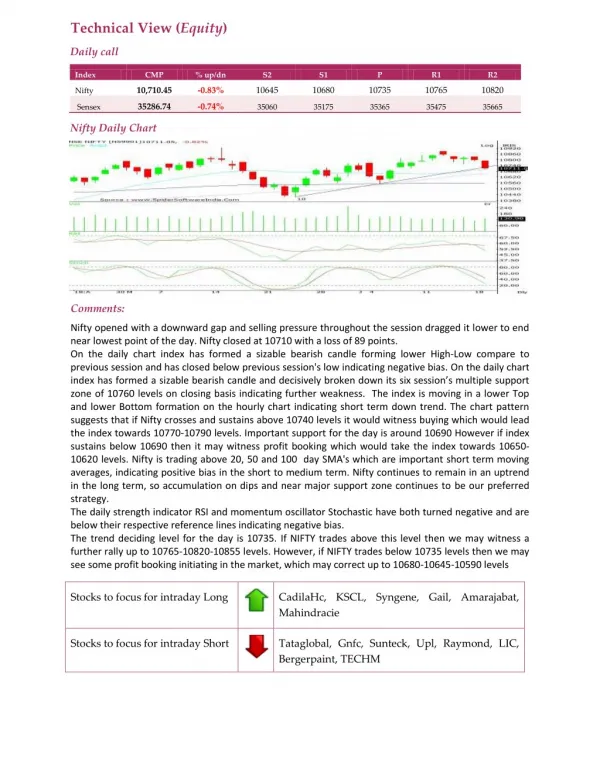
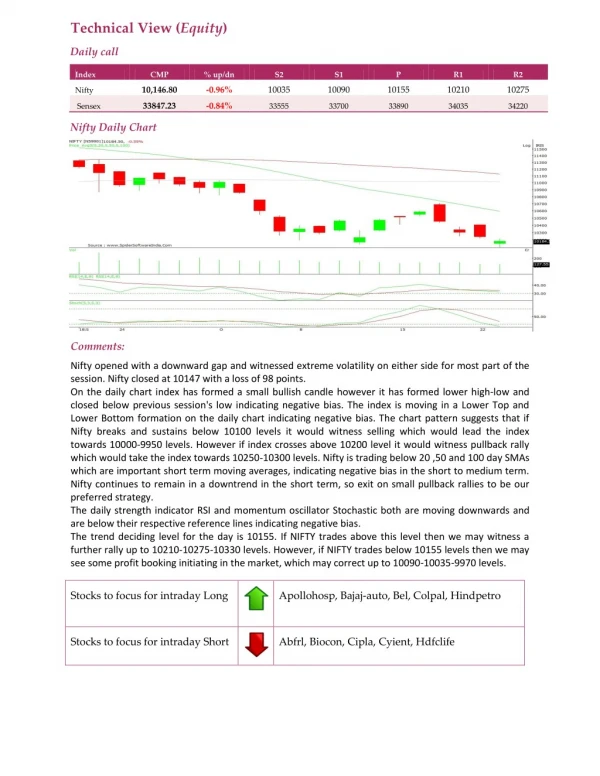
Technical View (Equity) Daily call Index CMP % up/dn S2 S1 P R1 R2 10,146.80 -0.96% 10035 10090 10155 10210 10275 Nifty 33847.23 -0.84% Sensex 33555 33700 33890 34035 34220 Nifty Daily Chart Comments: Nifty opened with a downward gap and witnessed extreme volatility on either side for most part of the session. Nifty closed at 10147 with a loss of 98 points. On the daily chart index has formed a small bullish candle however it has formed lower high-low and closed below previous session's low indicating negative bias. The index is moving in a Lower Top and Lower Bottom formation on the daily chart indicating negative bias. The chart pattern suggests that if Nifty breaks and sustains below 10100 levels it would witness selling which would lead the index towards 10000-9950 levels. However if index crosses above 10200 level it would witness pullback rally which would take the index towards 10250-10300 levels. Nifty is trading below 20 ,50 and 100 day SMAs which are important short term moving averages, indicating negative bias in the short to medium term. Nifty continues to remain in a downtrend in the short term, so exit on small pullback rallies to be our preferred strategy. The daily strength indicator RSI and momentum oscillator Stochastic both are moving downwards and are below their respective reference lines indicating negative bias. The trend deciding level for the day is 10155. If NIFTY trades above this level then we may witness a further rally up to 10210-10275-10330 levels. However, if NIFTY trades below 10155 levels then we may see some profit booking initiating in the market, which may correct up to 10090-10035-9970 levels. Stocks to focus for intraday Long Apollohosp, Bajaj-auto, Bel, Colpal, Hindpetro Stocks to focus for intraday Short Abfrl, Biocon, Cipla, Cyient, Hdfclife