Download
1 / 1
10 likes | 36 Views
Axis Direct presents daily derivatives report presenting recommendations based on technical analysis. For trading in derivatives visit https://simplehai.axisdirect.in/offerings/products/derivatives<br>https://simplehai.axisdirect.in/share-stock-prices/nse/Tech-Mahindra-Ltd-17215<br>https://simplehai.axisdirect.in/share-stock-prices/nse/Ashok-Leyland-Ltd-31<br><br>

E N D
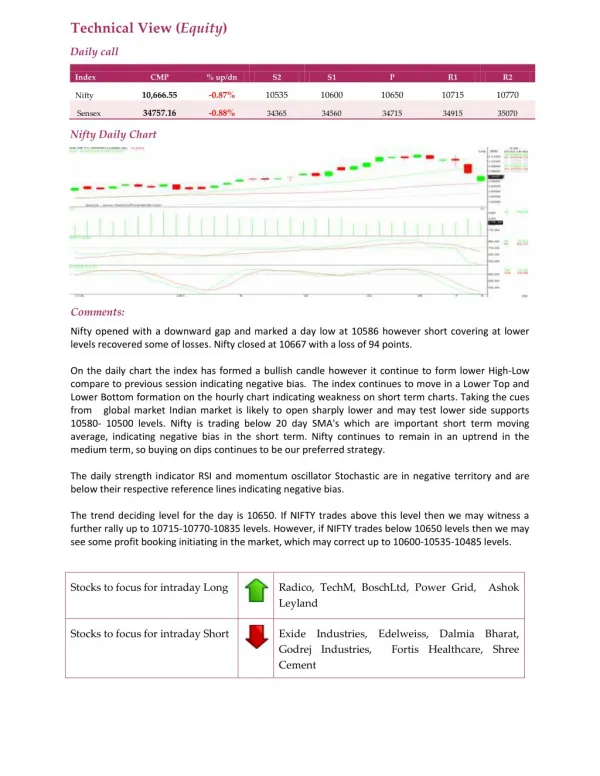
Technical View (Equity) Daily call Index CMP % up/dn S2 S1 P R1 R2 10,666.55 -0.87% 10535 10600 10650 10715 10770 Nifty 34757.16 -0.88% Sensex 34365 34560 34715 34915 35070 Nifty Daily Chart Comments: Nifty opened with a downward gap and marked a day low at 10586 however short covering at lower levels recovered some of losses. Nifty closed at 10667 with a loss of 94 points. On the daily chart the index has formed a bullish candle however it continue to form lower High-Low compare to previous session indicating negative bias. The index continues to move in a Lower Top and Lower Bottom formation on the hourly chart indicating weakness on short term charts. Taking the cues from global market Indian market is likely to open sharply lower and may test lower side supports 10580- 10500 levels. Nifty is trading below 20 day SMA's which are important short term moving average, indicating negative bias in the short term. Nifty continues to remain in an uptrend in the medium term, so buying on dips continues to be our preferred strategy. The daily strength indicator RSI and momentum oscillator Stochastic are in negative territory and are below their respective reference lines indicating negative bias. The trend deciding level for the day is 10650. If NIFTY trades above this level then we may witness a further rally up to 10715-10770-10835 levels. However, if NIFTY trades below 10650 levels then we may see some profit booking initiating in the market, which may correct up to 10600-10535-10485 levels. Radico, TechM, BoschLtd, Power Grid, Ashok Leyland Stocks to focus for intraday Long Stocks to focus for intraday Short Exide Industries, Edelweiss, Dalmia Bharat, Godrej Industries, Fortis Healthcare, Shree Cement