Download
1 / 1
10 likes | 46 Views
Axis Direct presents daily derivatives report presenting recommendations based on technical analysis. For trading in derivatives visit https://simplehai.axisdirect.in/offerings/products/derivatives

E N D
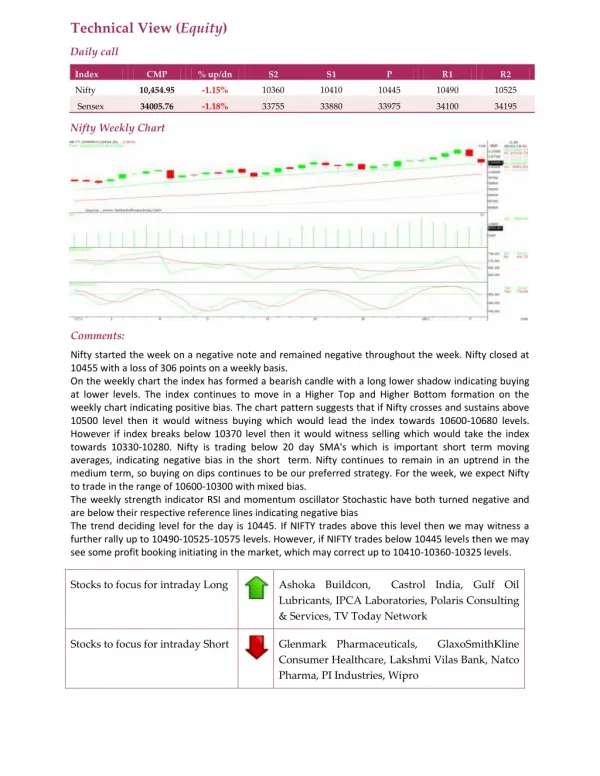
Technical View (Equity) Daily call Index CMP % up/dn S2 S1 P R1 R2 Nifty 10,454.95 -1.15% 10360 10410 10445 10490 10525 Sensex 34005.76 -1.18% 33755 33880 33975 34100 34195 Nifty Weekly Chart Comments: Nifty started the week on a negative note and remained negative throughout the week. Nifty closed at 10455 with a loss of 306 points on a weekly basis. On the weekly chart the index has formed a bearish candle with a long lower shadow indicating buying at lower levels. The index continues to move in a Higher Top and Higher Bottom formation on the weekly chart indicating positive bias. The chart pattern suggests that if Nifty crosses and sustains above 10500 level then it would witness buying which would lead the index towards 10600-10680 levels. However if index breaks below 10370 level then it would witness selling which would take the index towards 10330-10280. Nifty is trading below 20 day SMA's which is important short term moving averages, indicating negative bias in the short term. Nifty continues to remain in an uptrend in the medium term, so buying on dips continues to be our preferred strategy. For the week, we expect Nifty to trade in the range of 10600-10300 with mixed bias. The weekly strength indicator RSI and momentum oscillator Stochastic have both turned negative and are below their respective reference lines indicating negative bias The trend deciding level for the day is 10445. If NIFTY trades above this level then we may witness a further rally up to 10490-10525-10575 levels. However, if NIFTY trades below 10445 levels then we may see some profit booking initiating in the market, which may correct up to 10410-10360-10325 levels. Ashoka Buildcon, Castrol India, Gulf Oil Lubricants, IPCA Laboratories, Polaris Consulting & Services, TV Today Network Stocks to focus for intraday Long Glenmark Pharmaceuticals, GlaxoSmithKline Consumer Healthcare,Lakshmi Vilas Bank, Natco Pharma, PI Industries, Wipro Stocks to focus for intraday Short