Download
1 / 1
10 likes | 26 Views
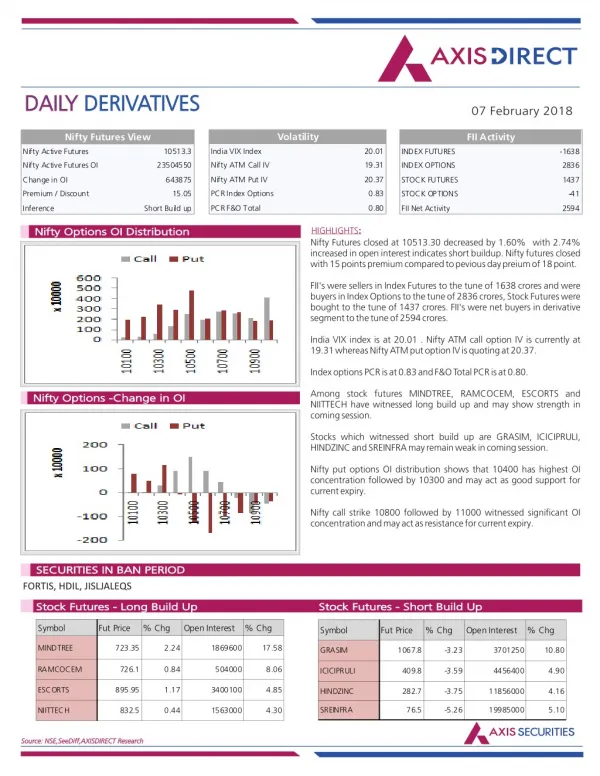
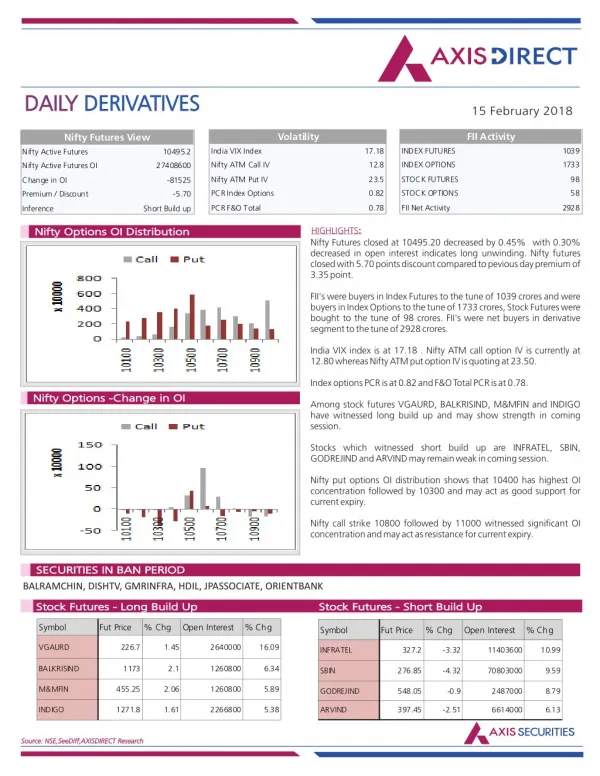
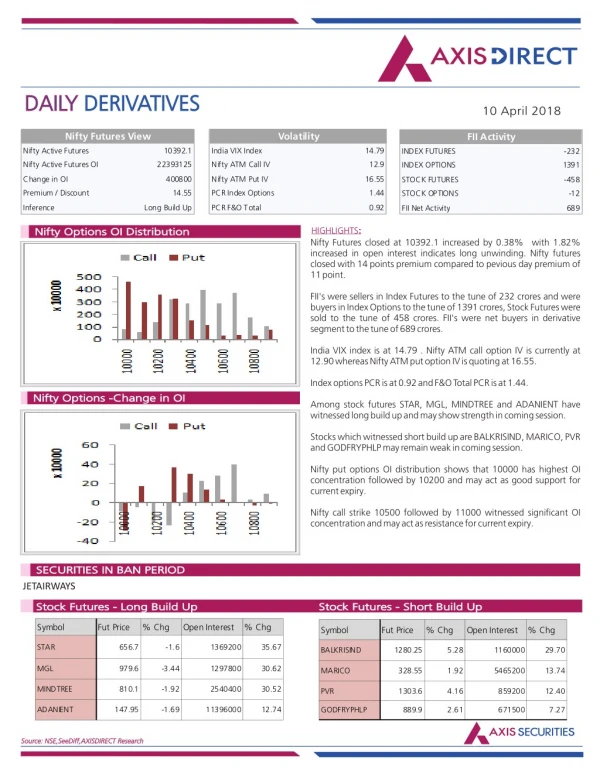
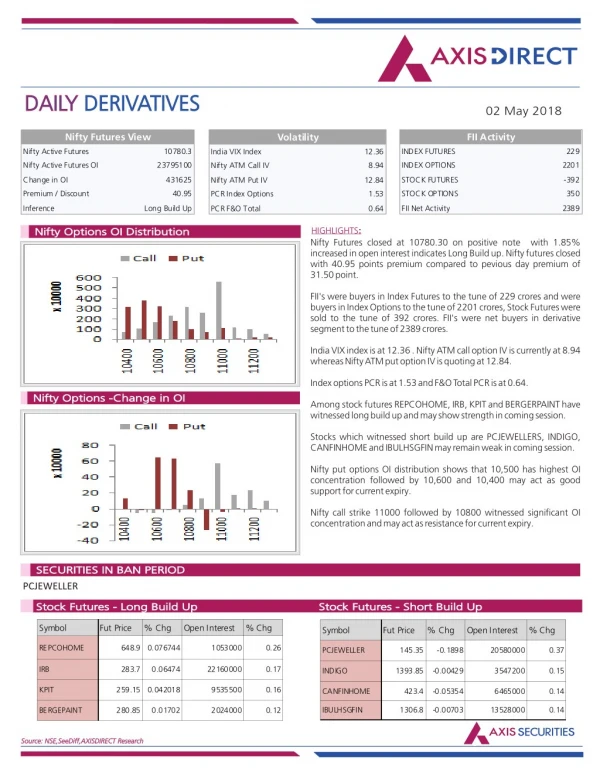
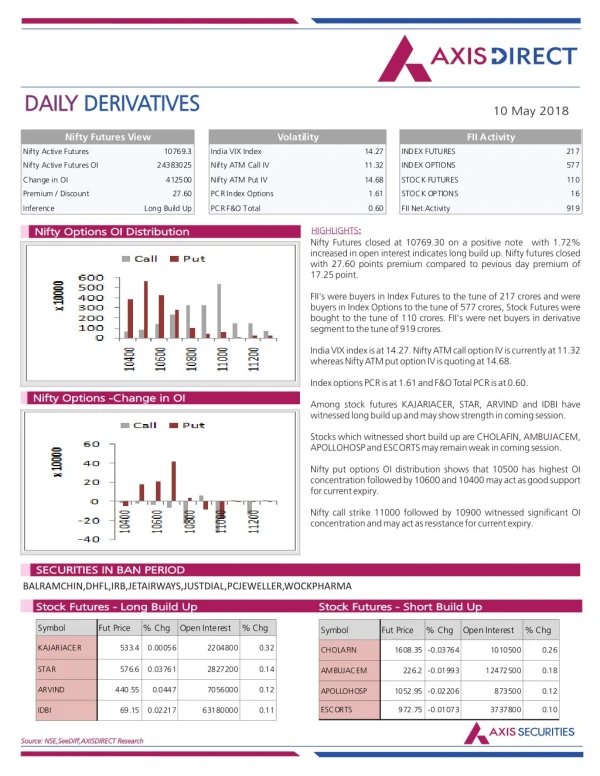
Axis Direct presents daily derivatives report presenting recommendations based on technical analysis. For trading in derivatives visit https://simplehai.axisdirect.in/offerings/products/derivatives<br>https://simplehai.axisdirect.in/share-stock-prices/nse/Oil-&-Natural-Gas-Corpn-Ltd-6068<br>https://simplehai.axisdirect.in/share-stock-prices/nse/Adani-Ports-&-Special-Economic-Zone-Ltd-21281<br>https://simplehai.axisdirect.in/share-stock-prices/nse/Coal-India-Ltd-12019

E N D
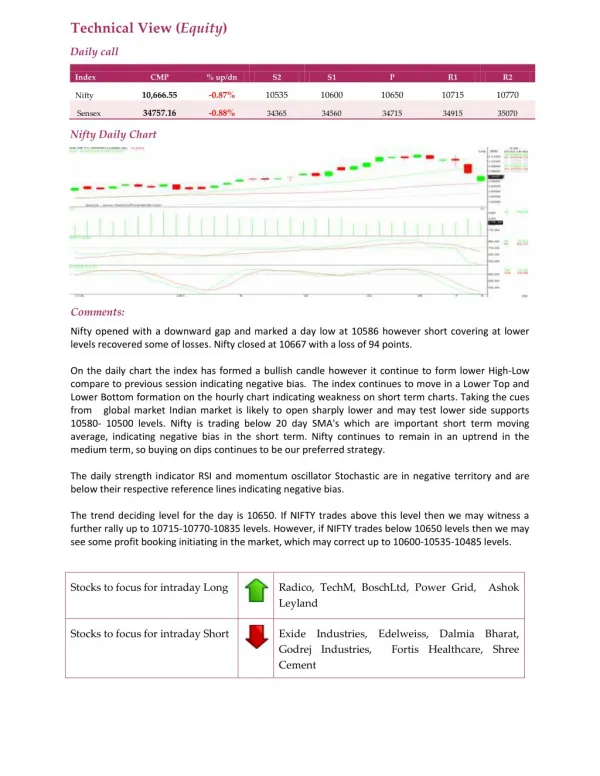
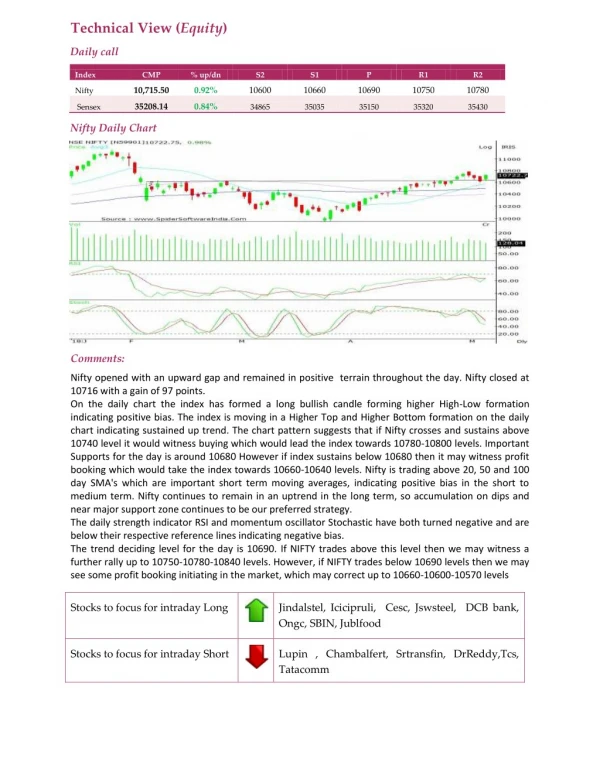
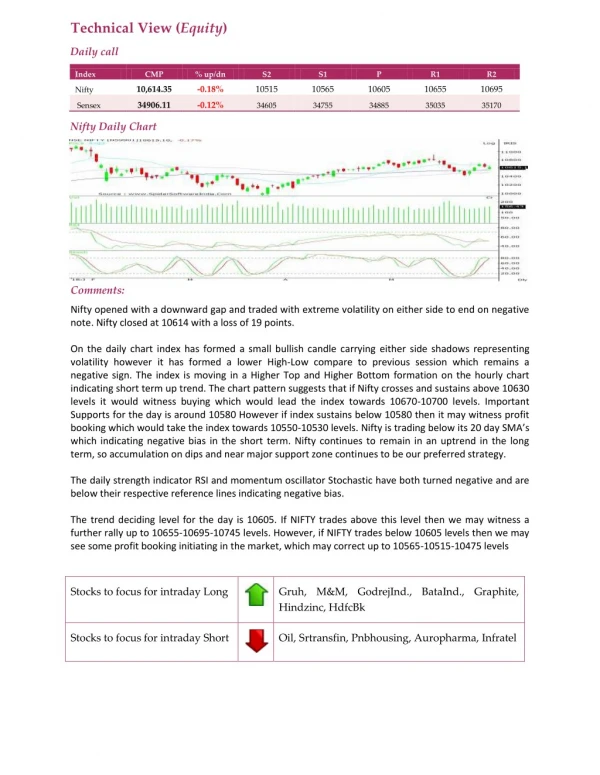
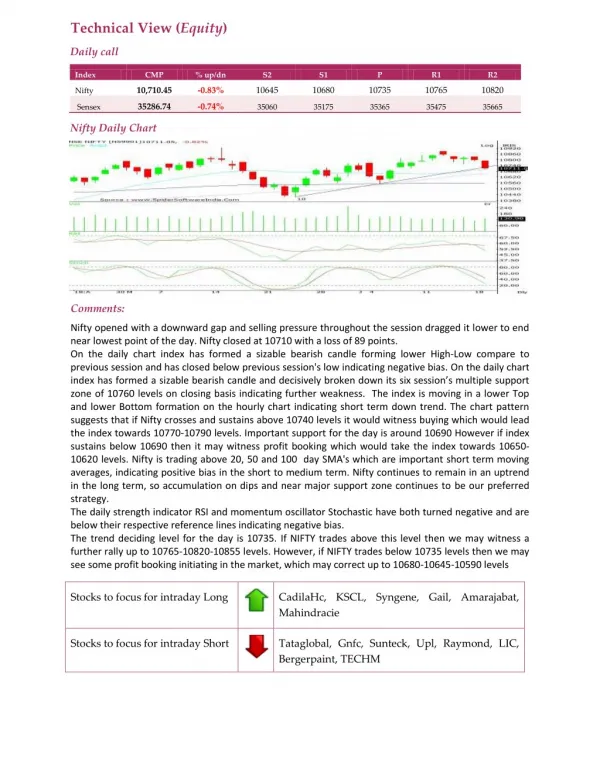
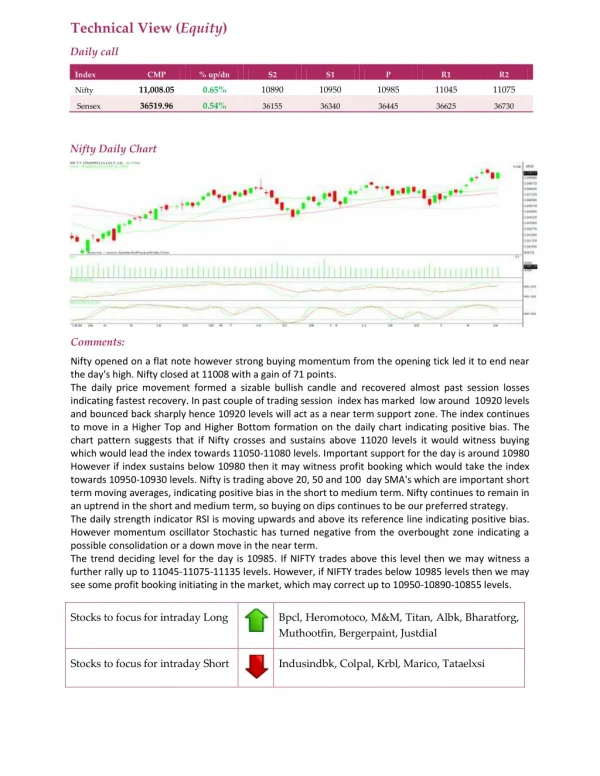
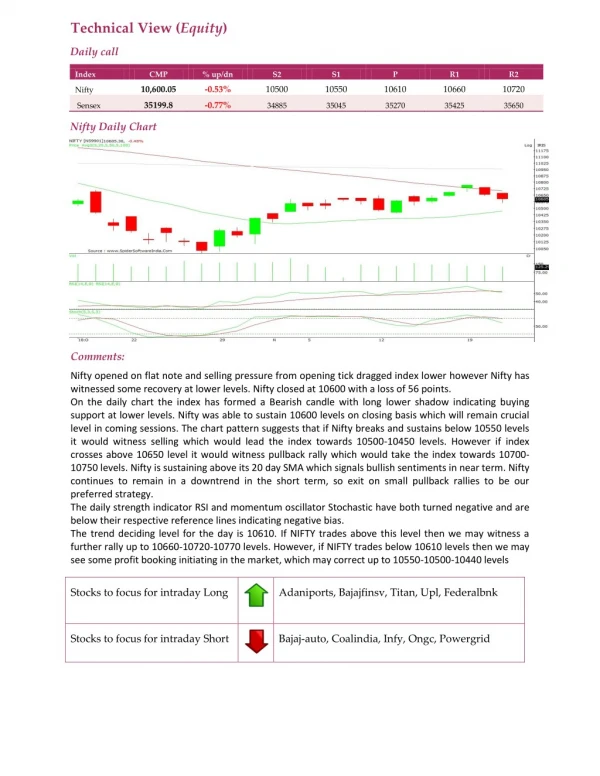
Technical View (Equity) Daily call Index CMP % up/dn S2 S1 P R1 R2 10,600.05 -0.53% 10500 10550 10610 10660 10720 Nifty 35199.8 -0.77% Sensex 34885 35045 35270 35425 35650 Nifty Daily Chart Comments: Nifty opened on flat note and selling pressure from opening tick dragged index lower however Nifty has witnessed some recovery at lower levels. Nifty closed at 10600 with a loss of 56 points. On the daily chart the index has formed a Bearish candle with long lower shadow indicating buying support at lower levels. Nifty was able to sustain 10600 levels on closing basis which will remain crucial level in coming sessions. The chart pattern suggests that if Nifty breaks and sustains below 10550 levels it would witness selling which would lead the index towards 10500-10450 levels. However if index crosses above 10650 level it would witness pullback rally which would take the index towards 10700- 10750 levels. Nifty is sustaining above its 20 day SMA which signals bullish sentiments in near term. Nifty continues to remain in a downtrend in the short term, so exit on small pullback rallies to be our preferred strategy. The daily strength indicator RSI and momentum oscillator Stochastic have both turned negative and are below their respective reference lines indicating negative bias. The trend deciding level for the day is 10610. If NIFTY trades above this level then we may witness a further rally up to 10660-10720-10770 levels. However, if NIFTY trades below 10610 levels then we may see some profit booking initiating in the market, which may correct up to 10550-10500-10440 levels Stocks to focus for intraday Long Adaniports, Bajajfinsv, Titan, Upl, Federalbnk Stocks to focus for intraday Short Bajaj-auto, Coalindia, Infy, Ongc, Powergrid