Download
1 / 1
10 likes | 36 Views
Axis Direct presents daily derivatives report presenting recommendations based on technical analysis. For trading in derivatives visit https://simplehai.axisdirect.in/offerings/products/derivatives<br>https://simplehai.axisdirect.in/share-stock-prices/nse/Tata-Consultancy-Services-Ltd-5400

E N D
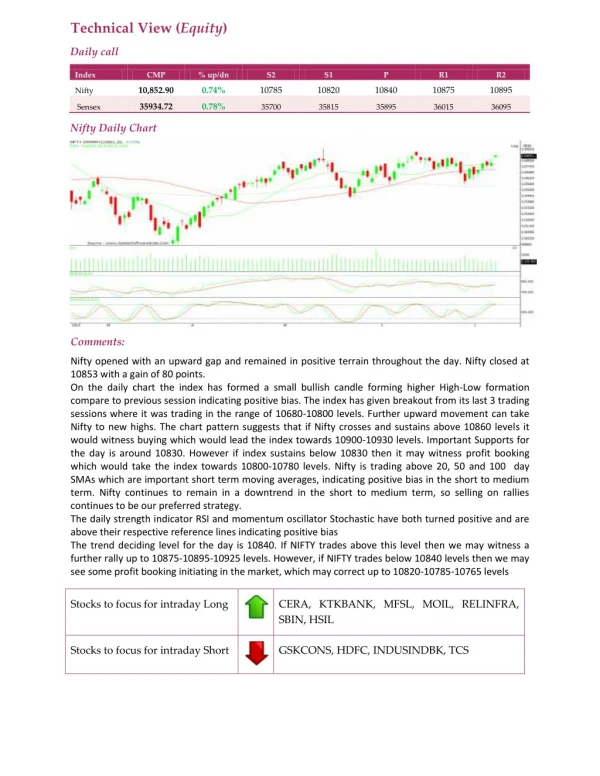
Technical View (Equity) Daily call Index CMP % up/dn S2 S1 P R1 R2 10,852.90 0.74% 10785 10820 10840 10875 10895 Nifty 35934.72 0.78% Sensex 35700 35815 35895 36015 36095 Nifty Daily Chart Comments: Nifty opened with an upward gap and remained in positive terrain throughout the day. Nifty closed at 10853 with a gain of 80 points. On the daily chart the index has formed a small bullish candle forming higher High-Low formation compare to previous session indicating positive bias. The index has given breakout from its last 3 trading sessions where it was trading in the range of 10680-10800 levels. Further upward movement can take Nifty to new highs. The chart pattern suggests that if Nifty crosses and sustains above 10860 levels it would witness buying which would lead the index towards 10900-10930 levels. Important Supports for the day is around 10830. However if index sustains below 10830 then it may witness profit booking which would take the index towards 10800-10780 levels. Nifty is trading above 20, 50 and 100 day SMAs which are important short term moving averages, indicating positive bias in the short to medium term. Nifty continues to remain in a downtrend in the short to medium term, so selling on rallies continues to be our preferred strategy. The daily strength indicator RSI and momentum oscillator Stochastic have both turned positive and are above their respective reference lines indicating positive bias The trend deciding level for the day is 10840. If NIFTY trades above this level then we may witness a further rally up to 10875-10895-10925 levels. However, if NIFTY trades below 10840 levels then we may see some profit booking initiating in the market, which may correct up to 10820-10785-10765 levels Stocks to focus for intraday Long CERA, KTKBANK, MFSL, MOIL, RELINFRA, SBIN, HSIL Stocks to focus for intraday Short GSKCONS, HDFC, INDUSINDBK, TCS