Download
1 / 1
10 likes | 26 Views
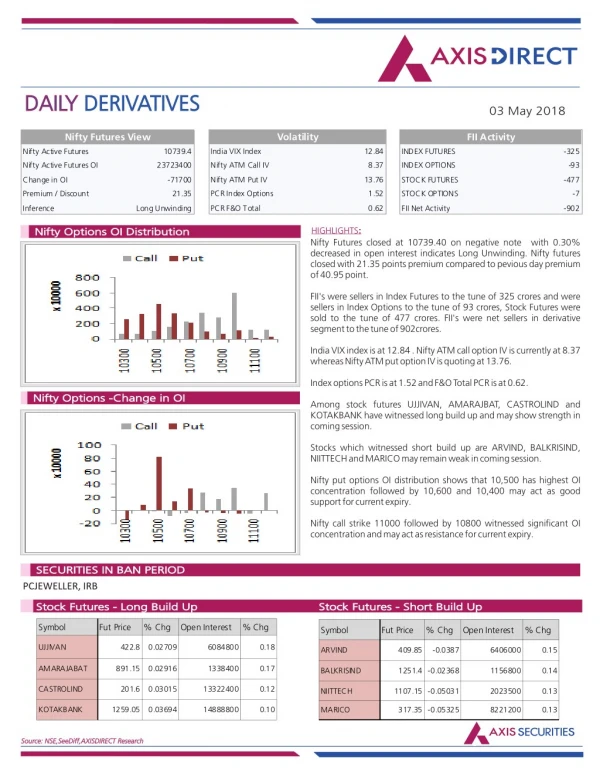
Axis Direct presents daily derivatives report presenting recommendations based on technical analysis. For trading in derivatives visit https://simplehai.axisdirect.in/offerings/products/derivatives<br>https://simplehai.axisdirect.in/share-stock-prices/nse/Bharat-Petroleum-Corporation-Ltd-2290<br>https://simplehai.axisdirect.in/share-stock-prices/nse/Asian-Paints-Ltd-34

E N D
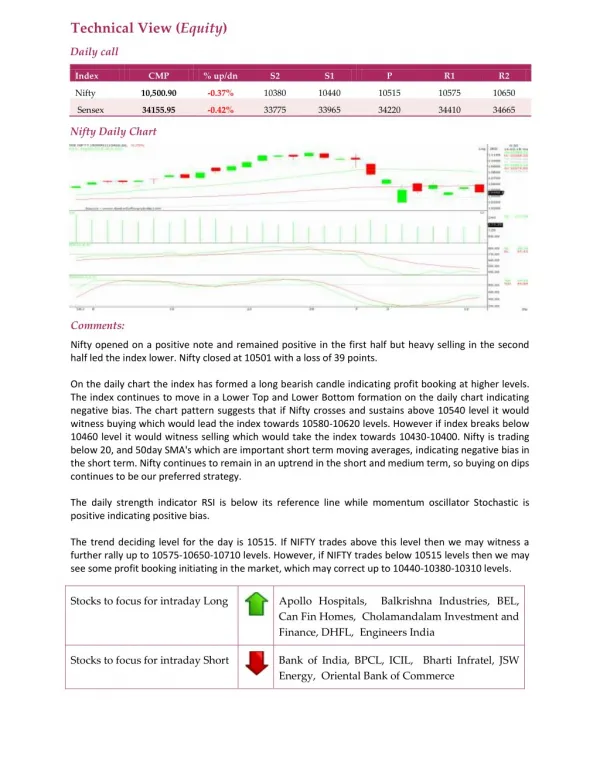
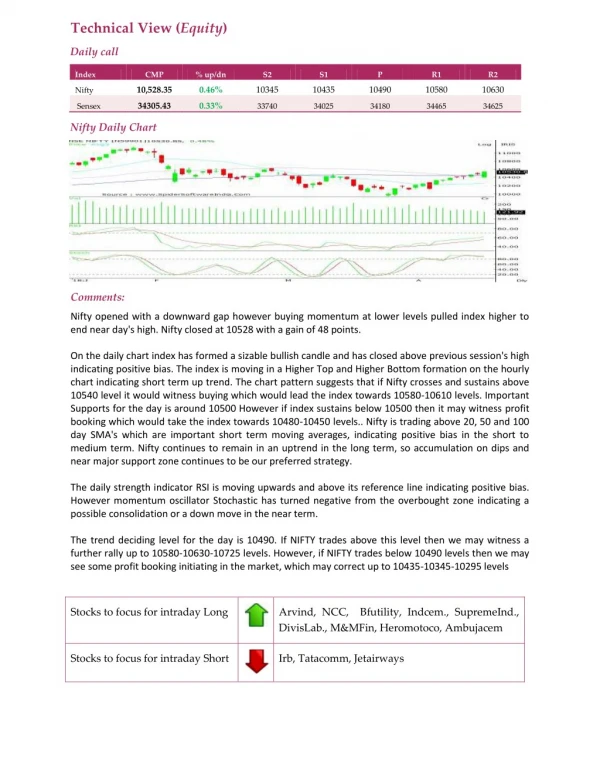
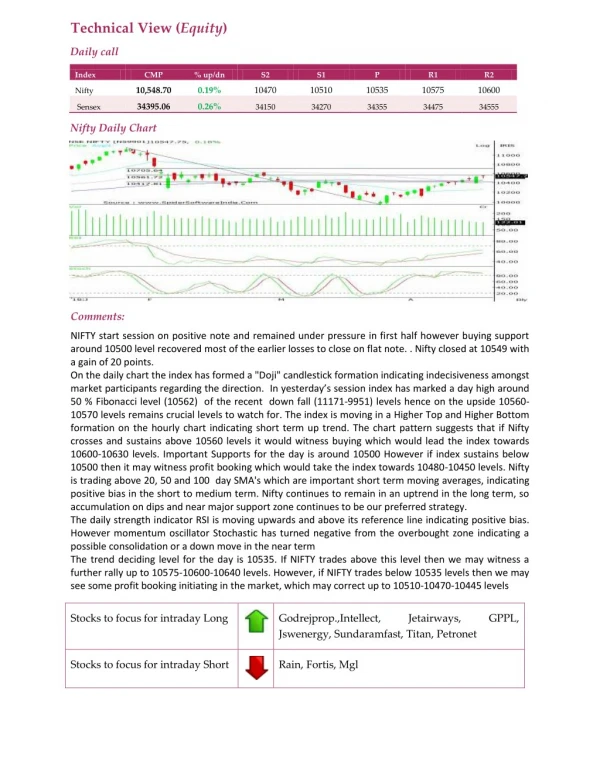
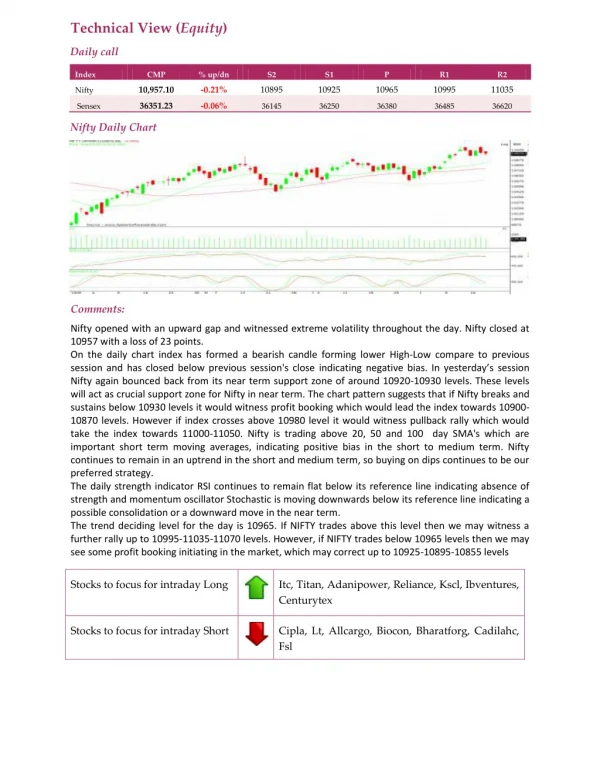
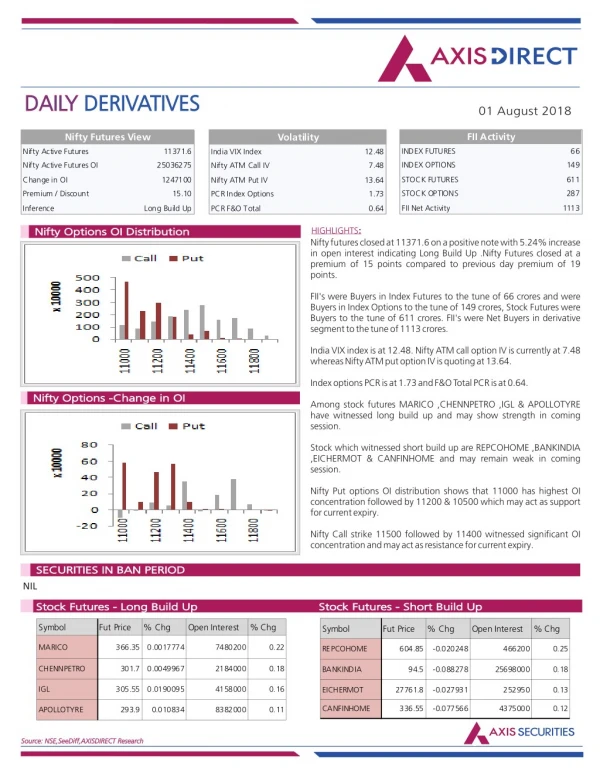
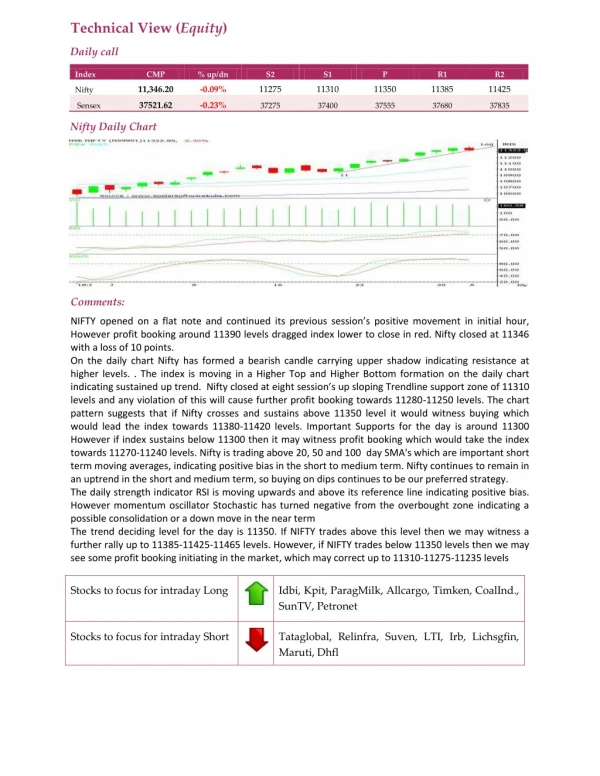
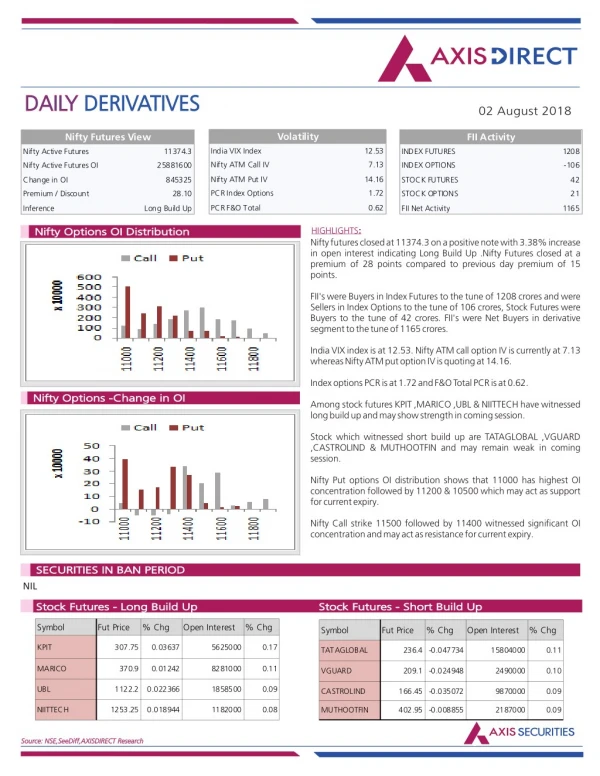
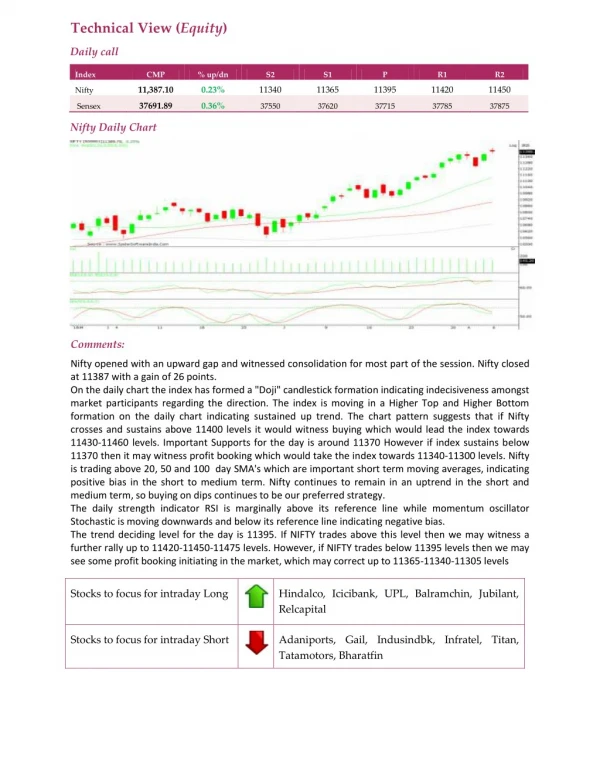
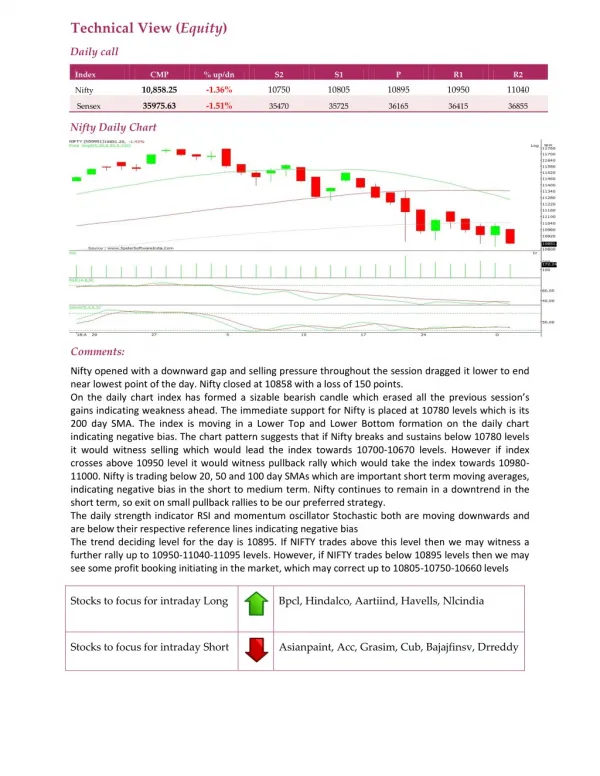
Technical View (Equity) Daily call Index CMP % up/dn S2 S1 P R1 R2 10,858.25 -1.36% 10750 10805 10895 10950 11040 Nifty 35975.63 -1.51% Sensex 35470 35725 36165 36415 36855 Nifty Daily Chart Comments: Nifty opened with a downward gap and selling pressure throughout the session dragged it lower to end near lowest point of the day. Nifty closed at 10858 with a loss of 150 points. On the daily chart index has formed a sizable bearish candle which erased all the previous session’s gains indicating weakness ahead. The immediate support for Nifty is placed at 10780 levels which is its 200 day SMA. The index is moving in a Lower Top and Lower Bottom formation on the daily chart indicating negative bias. The chart pattern suggests that if Nifty breaks and sustains below 10780 levels it would witness selling which would lead the index towards 10700-10670 levels. However if index crosses above 10950 level it would witness pullback rally which would take the index towards 10980- 11000. Nifty is trading below 20, 50 and 100 day SMAs which are important short term moving averages, indicating negative bias in the short to medium term. Nifty continues to remain in a downtrend in the short term, so exit on small pullback rallies to be our preferred strategy. The daily strength indicator RSI and momentum oscillator Stochastic both are moving downwards and are below their respective reference lines indicating negative bias The trend deciding level for the day is 10895. If NIFTY trades above this level then we may witness a further rally up to 10950-11040-11095 levels. However, if NIFTY trades below 10895 levels then we may see some profit booking initiating in the market, which may correct up to 10805-10750-10660 levels Stocks to focus for intraday Long Bpcl, Hindalco, Aartiind, Havells, Nlcindia Stocks to focus for intraday Short Asianpaint, Acc, Grasim, Cub, Bajajfinsv, Drreddy