Download
1 / 1
10 likes | 33 Views
Axis Direct presents daily derivatives report presenting recommendations based on technical analysis. For trading in derivatives visit https://simplehai.axisdirect.in/offerings/products/derivatives<br>https://simplehai.axisdirect.in/share-stock-prices/nse/DLF-Ltd-6890<br>https://simplehai.axisdirect.in/share-stock-prices/nse/CEAT-Ltd-104

E N D
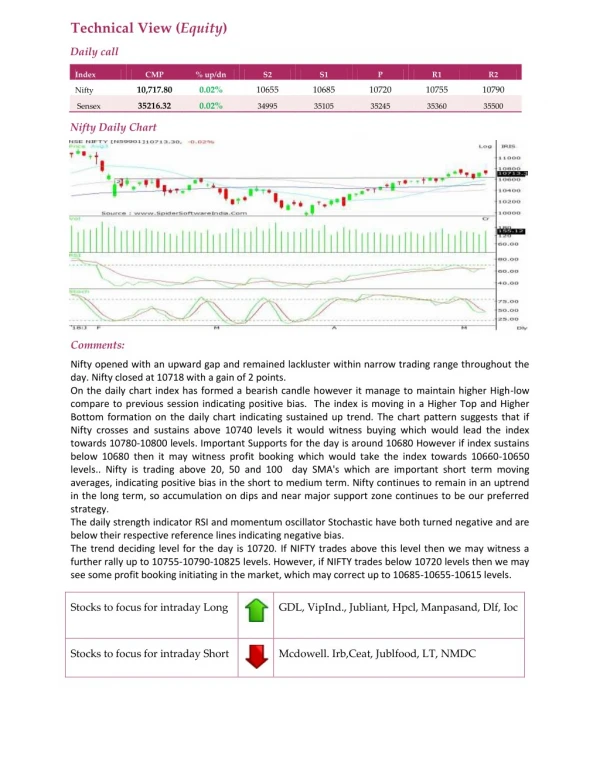
Technical View (Equity) Daily call Index CMP % up/dn S2 S1 P R1 R2 10,717.80 0.02% 10655 10685 10720 10755 10790 Nifty 35216.32 0.02% Sensex 34995 35105 35245 35360 35500 Nifty Daily Chart Comments: Nifty opened with an upward gap and remained lackluster within narrow trading range throughout the day. Nifty closed at 10718 with a gain of 2 points. On the daily chart index has formed a bearish candle however it manage to maintain higher High-low compare to previous session indicating positive bias. The index is moving in a Higher Top and Higher Bottom formation on the daily chart indicating sustained up trend. The chart pattern suggests that if Nifty crosses and sustains above 10740 levels it would witness buying which would lead the index towards 10780-10800 levels. Important Supports for the day is around 10680 However if index sustains below 10680 then it may witness profit booking which would take the index towards 10660-10650 levels.. Nifty is trading above 20, 50 and 100 day SMA's which are important short term moving averages, indicating positive bias in the short to medium term. Nifty continues to remain in an uptrend in the long term, so accumulation on dips and near major support zone continues to be our preferred strategy. The daily strength indicator RSI and momentum oscillator Stochastic have both turned negative and are below their respective reference lines indicating negative bias. The trend deciding level for the day is 10720. If NIFTY trades above this level then we may witness a further rally up to 10755-10790-10825 levels. However, if NIFTY trades below 10720 levels then we may see some profit booking initiating in the market, which may correct up to 10685-10655-10615 levels. Stocks to focus for intraday Long GDL, VipInd., Jubliant, Hpcl, Manpasand, Dlf, Ioc Stocks to focus for intraday Short Mcdowell. Irb,Ceat, Jublfood, LT, NMDC