Download
1 / 1
10 likes | 41 Views
Axis Direct presents daily derivatives report presenting recommendations based on technical analysis. For trading in derivatives visit https://simplehai.axisdirect.in/offerings/products/derivatives<br>https://simplehai.axisdirect.in/share-stock-prices/nse/ICICI-Bank-Ltd-5418<br>https://simplehai.axisdirect.in/share-stock-prices/nse/Adani-Ports-&-Special-Economic-Zone-Ltd-21281<br>

E N D
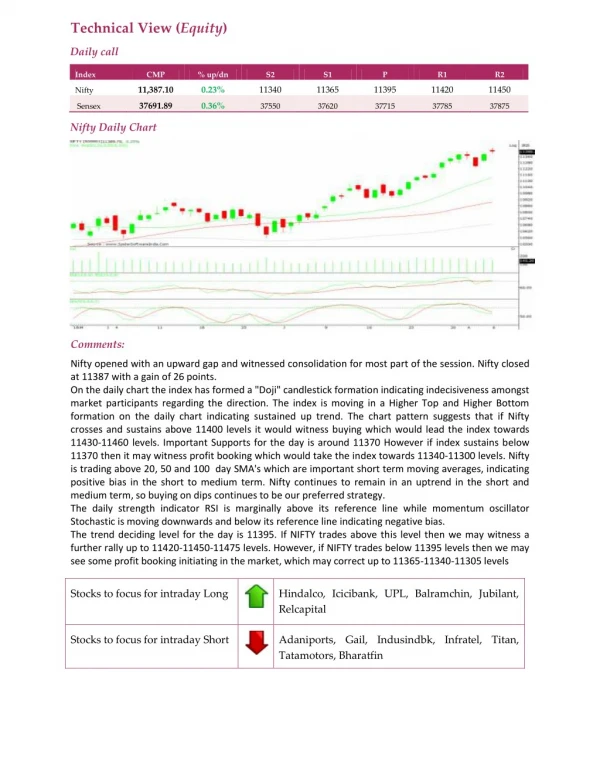
Technical View (Equity) Daily call Index CMP % up/dn S2 S1 P R1 R2 11,387.10 0.23% 11340 11365 11395 11420 11450 Nifty 37691.89 0.36% Sensex 37550 37620 37715 37785 37875 Nifty Daily Chart Comments: Nifty opened with an upward gap and witnessed consolidation for most part of the session. Nifty closed at 11387 with a gain of 26 points. On the daily chart the index has formed a "Doji" candlestick formation indicating indecisiveness amongst market participants regarding the direction. The index is moving in a Higher Top and Higher Bottom formation on the daily chart indicating sustained up trend. The chart pattern suggests that if Nifty crosses and sustains above 11400 levels it would witness buying which would lead the index towards 11430-11460 levels. Important Supports for the day is around 11370 However if index sustains below 11370 then it may witness profit booking which would take the index towards 11340-11300 levels. Nifty is trading above 20, 50 and 100 day SMA's which are important short term moving averages, indicating positive bias in the short to medium term. Nifty continues to remain in an uptrend in the short and medium term, so buying on dips continues to be our preferred strategy. The daily strength indicator RSI is marginally above its reference line while momentum oscillator Stochastic is moving downwards and below its reference line indicating negative bias. The trend deciding level for the day is 11395. If NIFTY trades above this level then we may witness a further rally up to 11420-11450-11475 levels. However, if NIFTY trades below 11395 levels then we may see some profit booking initiating in the market, which may correct up to 11365-11340-11305 levels Stocks to focus for intraday Long Hindalco, Icicibank, UPL, Balramchin, Jubilant, Relcapital Stocks to focus for intraday Short Adaniports, Gail, Indusindbk, Infratel, Titan, Tatamotors, Bharatfin