Download
1 / 1
10 likes | 23 Views
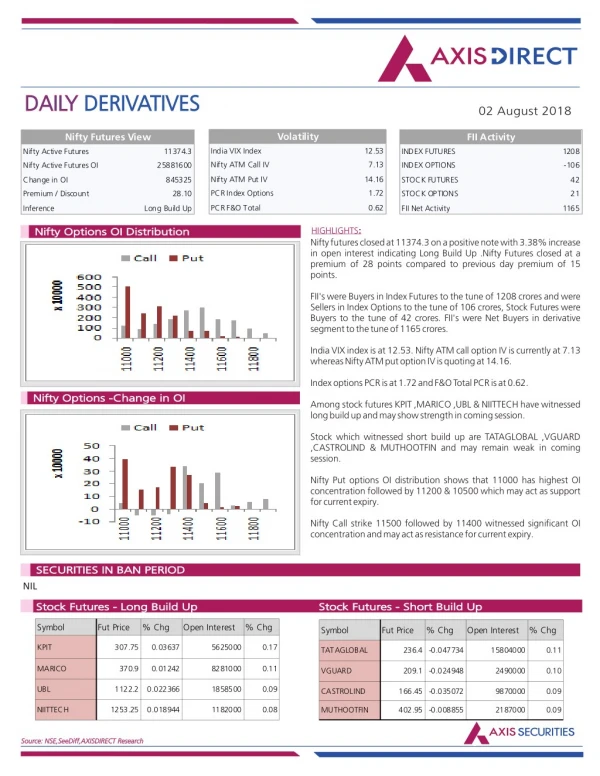
Axis Direct presents daily derivatives report presenting recommendations based on technical analysis. For trading in derivatives visit https://simplehai.axisdirect.in/offerings/products/derivatives<br>https://simplehai.axisdirect.in/share-stock-prices/nse/Wipro-Ltd-614

E N D
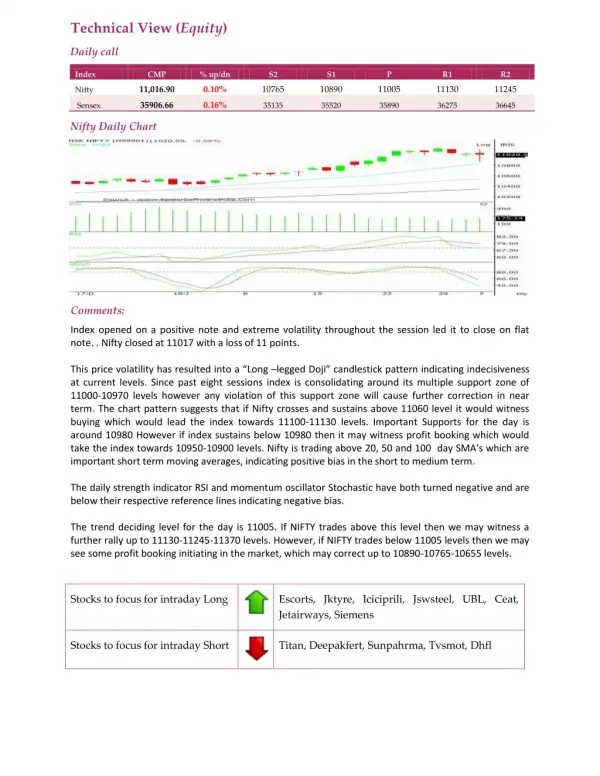
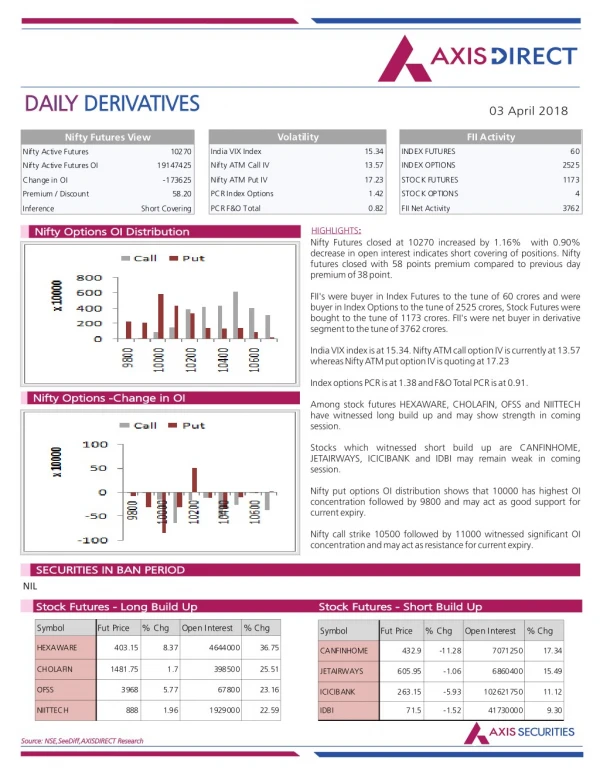
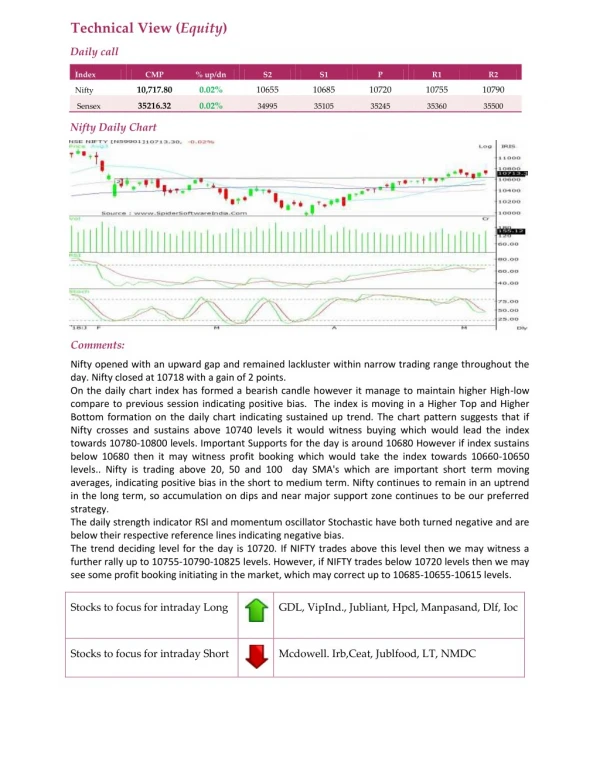
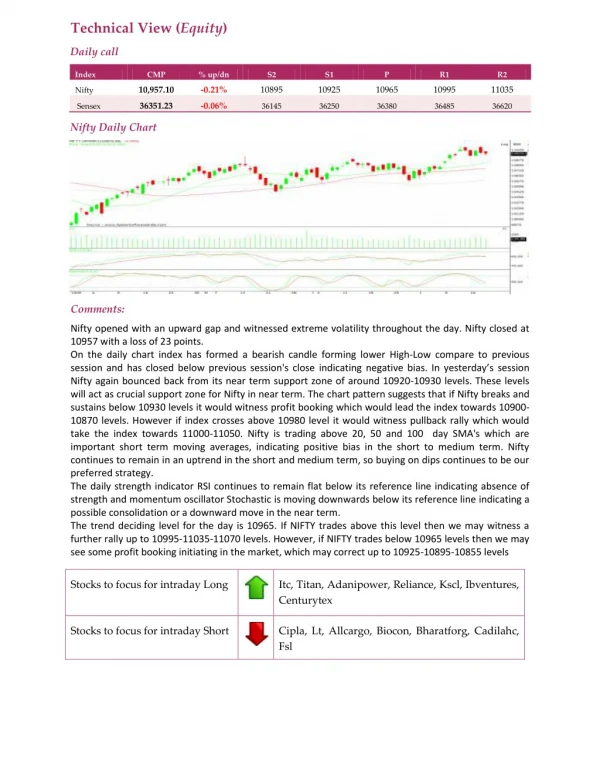
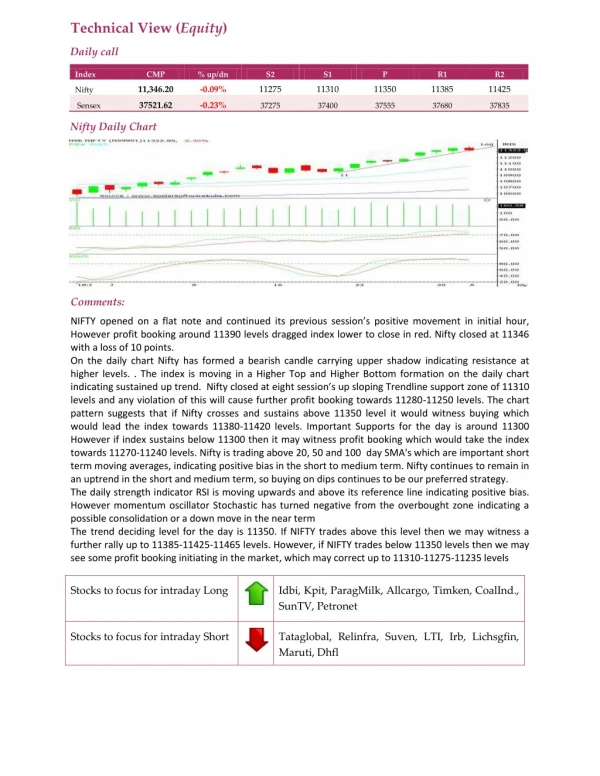
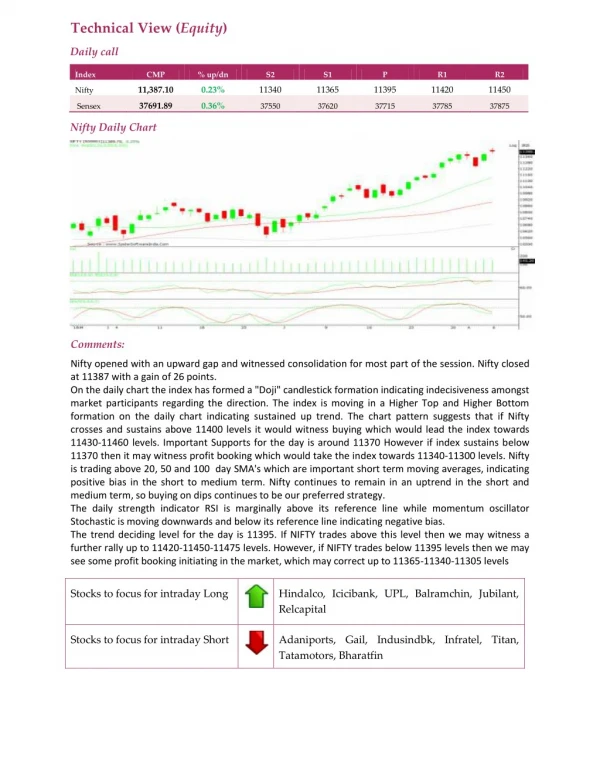
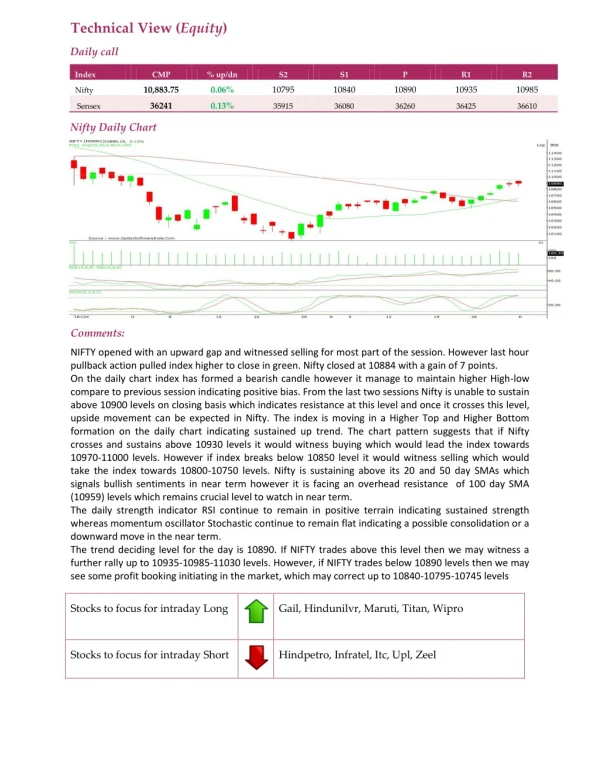
Technical View (Equity) Daily call Index CMP % up/dn S2 S1 P R1 R2 10,883.75 0.06% 10795 10840 10890 10935 10985 Nifty 36241 0.13% Sensex 35915 36080 36260 36425 36610 Nifty Daily Chart Comments: NIFTY opened with an upward gap and witnessed selling for most part of the session. However last hour pullback action pulled index higher to close in green. Nifty closed at 10884 with a gain of 7 points. On the daily chart index has formed a bearish candle however it manage to maintain higher High-low compare to previous session indicating positive bias. From the last two sessions Nifty is unable to sustain above 10900 levels on closing basis which indicates resistance at this level and once it crosses this level, upside movement can be expected in Nifty. The index is moving in a Higher Top and Higher Bottom formation on the daily chart indicating sustained up trend. The chart pattern suggests that if Nifty crosses and sustains above 10930 levels it would witness buying which would lead the index towards 10970-11000 levels. However if index breaks below 10850 level it would witness selling which would take the index towards 10800-10750 levels. Nifty is sustaining above its 20 and 50 day SMAs which signals bullish sentiments in near term however it is facing an overhead resistance of 100 day SMA (10959) levels which remains crucial level to watch in near term. The daily strength indicator RSI continue to remain in positive terrain indicating sustained strength whereas momentum oscillator Stochastic continue to remain flat indicating a possible consolidation or a downward move in the near term. The trend deciding level for the day is 10890. If NIFTY trades above this level then we may witness a further rally up to 10935-10985-11030 levels. However, if NIFTY trades below 10890 levels then we may see some profit booking initiating in the market, which may correct up to 10840-10795-10745 levels Stocks to focus for intraday Long Gail, Hindunilvr, Maruti, Titan, Wipro Stocks to focus for intraday Short Hindpetro, Infratel, Itc, Upl, Zeel