Download
1 / 57
600 likes | 839 Views
SOM y SOTA: Clustering methods in the analysis of massive biological data. Joaquín Dopazo. CNIO. Genes in the DNA. …whose final effect can be different because of the variability. Between 30.000 and 100.000. 40-60% display alternative splicing. >protein kunase

E N D
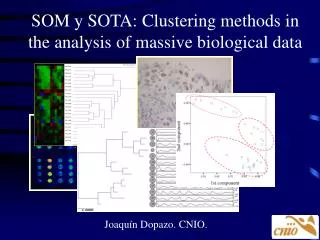
SOM y SOTA: Clustering methods in the analysis of massive biological data Joaquín Dopazo. CNIO.
Genes in the DNA... …whose final effect can be different because of the variability. Between 30.000 and 100.000. 40-60% display alternative splicing >protein kunase acctgttgatggcgacagggactgtatgctgatctatgctgatgcatgcatgctgactactgatgtgggggctattgacttgatgtctatc.... …code for the structure of proteins... More than 3 millon SNPs have been mapped From genotype to phenotype. (only the genetic component) That undergo post-translational modifications …conforming complex interaction networks... …which accounts for the function... …in cooperation with other proteins… A typical tissue is expressing among 5000 and 10000 genes …providing they are expressed in the proper moment and place... Each protein has an average of 8 interactions
Pre-genomics scnario in the lab >protein kunase acctgttgatggcgacagggactgtatgctgatctatgctgatgcatgcatgctgactactgatgtgggggctattgacttgatgtctatc....
Phylogenetic tree Molecular databases Search results Information Motif databases alignment Motif Conserved region Secondary and tertiary protein structure Bioinformatics tools for pre-genomicsequence data analysis Sequence The aim: Extracting as much information as possible for one single data
SNPs Expression Arrays Post-genomic vision Who? Genome sequencing Literature, databases 2-hybrid systems, Mass spectrometry for protein complexes What do we know? And who else? In what way? Where, when and how much?
polimorphisms Gene expression Post-genomic vision genes Information The new tools: Clustering Feature selection Multiple correlation Datamining Information Databases interactions
Neural Networks Brain and computers Brain computes in a different way from digital computers Brain Computers Structural components Neurons (Ramón y Cajal, 1911) chips Speed slow (10-3s) fast (10-9s) Procesing units 10 billion neurons, massively interconnected (60 trillion synapses) One or few Brain is a highly complex, nonlinear, and parallel computer Neurons are organized to perform complex computations many times faster than the fastest computers.
What is a neural network? A Neural network is a massively parallel distributed processor able to store experiential knowledge and to make it available for use. It resembles to brain in two respects: Knowledge is acquired by the network through a learning process Interneuron connection strengths (synaptic weights) are used to store the knowledge.
Supervised Unsupervised Perceptrons Kohonen SOM Growing cell structures SOTA Neural Net classifiers
w1 w2 w2 S Supervised learning: the perceptron Activation function X1 X2 : : : : Xp X1 X2 : : : : Xp uk Output J(.) Input signals Summing junction : Threshold qk
w1 w2 S up =1 down = 0 W1 = 1 u =x1*w1+x2*w2 1 if u ³1 0 if u<1 J(u)= W2=0 Supervised learning : training Activation function down up Summing junction Training set 11111110000000 00000001111111 J(.) u
1 0 S up u =1*1+0*0= 1 1 if u ³1 0 if u<1 J(u)= Supervised learning: application Summing junction X 1 0 1 J(.) u
Supervised vs. Unsupervised learning Supervised: The structure of the data is known beforehand. After a training process in which the network learns how to distinguish among classes, you use the network for assigning new items to the predefined classes Unsupervised: The structure of the data is not know beforehand. The network learns how data are distributed among classes, based on a function of distance
Unsupervised learning:Kohonen self-organizing maps The basis Sensory pathways in the brain are organised in such a way that its arrangement reflects some physical characteristic of the external stimulus being sensed. • Brain of higher animals seems to contain many kind of “maps” in the cortex. • In visual areas there are orientation and color maps • In the auditory cortex there exist the so-called tonotopic maps • The somatotopic maps represents the skin surface
Kohonen SOMThe causes of self-organisation Kohonen SOM mimics two-dimensional arrangements of neurons in the brain. Effects leading to spatially organized maps are: • Spatial concentration of the network activity on the neuron best tuned to the present input • Further sensitization of the best matching neuron and its topological neighborhood.
x1, x2..xn input Kohonen SOMThe topology Two-dimensional network of cells with a hexagonal or rectangular (or other) arrangement. Output nodes
Neighborhood Neighborhood of a cell is defined as a time dependent function
Kohonen SOM The algorithm • Step 1. Initialize nodes to random values. • Set the initial radius of the neighborhood. • Step 2. Present new input:Compute distances to all nodes. Euclidean distances are commonly used • Step 3. Select output node j* with minimum distancedj. Update node j* and neighbors. Nodes updated for the neighborhood NEj*(t) as: • wij(t+1) = wij(t) + (t)(xi(t) - wij(t)); for jNEj*(t) • (t) is a gain term than decreases in time. • Step4 Repeat by going to Step 2 until convergence. Input
Kohonen SOMLimitations Arbitrary number of clusters The number of clusters is arbitrarily fixed from the beginning. Some clusters can remain unoccupied. Non proportional clustering Clusters are made based on the number of items so, distances among them are not proportional. Lack of the tree structure The use of a two-dimensional structure for the net makes impossible to recover a tree structure that relates the clusters and subclusters among them.
Growing cell structures Kohonen SOM produce topology-preserving mapping. That is, the topology of the network and the number of clusters are fixed before to the training of the network Growing cell structures produce distribution-preserving mapping. The number of clusters and the connections among them are dynamically assigned during the training of the network.
Insertion and deletion of neurons • After a fixed number of adaptations, every neuron q with a signal counter value hq > hc (a threshold) is used to create a new neuron • · The direct neighbor f of the neuron q having the greatest signal counter value is used to insert a new neuron between them. • · The new neuron is connected to preserve the topology of the network. • Signal counter values are adjusted in the neighborhood Similarly, neurons with signal counter values below a threshold can be removed.
Growing cell structuresNetwork dynamics • Similar to the used by Kohonen SOM, but with several important differences: • Adaptation strength is constant over time (eb and en for the best matching cell and its neighborhood). • Only the best-matching cell and its neighborhood are adapted. • Adaptation implies the increment of signal counter for the best-matching cell and the decrement in the remaining cells. • New cells can be inserted and existent cells can be removed in order to adapt the output map to the distribution of the input vectors.
Growing cell structuresLimitations Arbitrary number of clusters The number of clusters is arbitrarily fixed from the beginning. Some clusters can remain unoccupied. þ Non proportional clustering Clusters are made based on the number of items so, distances among them are not proportional. ¨ Lack of the tree structure The use of a two-dimensional structure for the net makes impossible to recover a tree structure that relates the clusters and subclusters among them. ¨
A B C D But, sometimes behing the real world there is some hierarchy... 20 items Many molecular data have different levels of structured information. Ej, phylogenies, molecular population data, DNA expression data (to same extent), etc. Simulation
Mapping a hierarchical structure using a non-hierarchical method (SOM) A,B G H C,D E,F
Self Organising Tree Algorithm (SOTA) A new neural network designed to deal with data that are related among them by means of a binary tree topology Dopazo & Carazo, 1997, J. Mol. Evol.44:226-233 • Derived from the Kohonen SOM and the growing cell structures but with several key differences: • The topology of the network is a binary tree. • Only growing of the network is allowed. • The growing mimics a speciation event, producing two new neurons from the most heterogeneous neuron. • Only terminal neurons are directly adapted by the input data, internal neurons are adapted through terminal neurons.
Step 1. Initialize nodes to random values. • Step 2. Present new input:Compute distances to all terminal nodes. • Step 3. Select output node j* with minimum distancedj. Update node j* and neighbors. Nodes updated for the neighborhood NEj*(t) as: • wij(t+1) = wij(t) + (t)(xi(t) - wij(t)); for jNEj*(t) • (t) is a gain term than decreases in time. • Step 4 Repeat by going to Step 2 until convergence. • Step 5 Reproduce the node with highest variability. SOTA:The algorithm The Self Organising Tree Algorithm (SOTA) is a hierarchical divisive method based on a neural network SOTA, unlike other hierarchical methods, grows from top to bottom until an appropriate level of variability is reached Input Dopazo, Carazo (1997) Herrero, Valencia, Dopazo (2001)
a s SOTA algorithm (neighborhood) Initial state w Actualization Growing and different neighborhoods
Initialise system sister mother winner Add cell Network convergence? SOTA algorithm • Cycle: repeat as many epochs as necessary to get convergence in the present state of the network. • Convergence: relative error of the network falls below a threshold • When a cycle finishes, the networksize increases: two new neurons are attached to the neuron with higher resources. This neuron becomes mother neuron and does not receive direct inputs any more. Cycle EPOCH NO Cycle convergence? YES NO YES End
Applications Sequence analysis Microarray data analysis Population data analysis
Sequence analysis in the genomics era • Massive data • Information • redundancy
Codification Indeterminaciones. R = {A ó G}; N= {A ó G ó C ó T} Vectores de N x 4 (nucleótidos) o N x 20 (aminoácidos); más una componente para representar las deleciones Other possible codifications: Frequencies of dipeptides or dinucleotides
Updating the neurons Updated Missing
Classifying proteins with SOM Ferrán, Pflugfelder and Ferrara (1994) Self-organized neural maps of human protein sequences. Prot. Sci. 3:507-521.
Gene expression analysis using DNA microarrays Cy5 Cy3 cDNA arrays Oligonucleotide arrays
Kb Gb Mb Tb - Pb Research paradigm is shifting Hipothesis driven: one PhD per gene Ignorance driven: paralelized automated approach sequences DNA arrays
Expression patterns 1 2 3 4 • Patterns can be: • time series • dosage series • different patients • different tissues • etc. Different DNA-arrays
The data A B C Different classes of experimental conditions, e.g. Cancer types, tissues, drug treatments, time survival, etc. • Characteristics of the data: • Low signal to noise ratio • High redundancy and intra-gene correlations • Most of the genes are not informative with respect to the trait we are studying (account forunrelated physiological conditions, etc.) • Many genes have no annotation!! Expression profile of all the genes for a experimental condition (array) Genes (thousands) Expression profile of a gene across the experimental conditions Experimental conditions (from tens up to no more than a few houndreds)
Study of many conditions.Types of problems Can we find groups of experiments with similar gene expression profiles? Unsupervised Different phenotypes... Supervised Reverse engineering What genes are responsible for? Molecular classification of samples What do they have in common? Co-expressing genes... Genes of a class What profile(s) do they display? and... Are there more genes? B C A How is the network? D Genes interacting in a network (A,B,C..)... E
What are we measuring? green A (background) Differential expression B/A red B (expression) Problem: is asymetrical solution: log-transformation 100/1 = 100 2 10/1 = 10 1 1/1 = 1 0 1/10 = 0.1 -1 1/100 = 0.01 -2 transformation
A B C Distance Differences B<=>C Correlation A<=>B
Clustering methods Non hierarchical Hierarchical deterministic K-means, PCA UPGMA NN SOM SOTA Robust Provides different levels of information Properties
Aggregative hierarchical clustering Relationships among profiles are represented by branch lengths. Links recursively the closest pair of profiles until the complete hierarchy is reconstructed Allows to explore the relationship among groups of related genes at higher levels. CLUSTER
Aggregative hierarchical clustering • Problems • lack of robustness • solution may be not unique • dependent on the data order
Subjective cluster definition What level would you consider for defining a cluster?
Properties of neural networks for molecular data classification • Robust • Manage real-world data sets containing noisy, ill-defined items with irrelevant variables and outliers • Statistical distributions do not need to be parametric • Fast and scalable to big data sets
Group11 samplea, sampleb ... Group12 samplea, sampleb ... Group13 samplea, sampleb ... Group14 samplea, sampleb ... Kohonen SOMApplied to microarray data t1 t2 .. tp sample1 a11 a12 .. a1p sample2 a21 a22 .. a2p : : : : samplen an1 an2 .. anp node44 x1 x2 .. xp node34 y1 y2 .. yp node24 z1 z2 .. zp
Kohonen SOMmicroarray patterns gen1 gen2 .. genp sample1 a11 a12 .. a1p sample2 a21 a22 .. a2p : : : : samplen an1 an2 .. anp
Kohonen SOMExample Response of human fibroblasts to serum Iyer et al., 1999 Science283:83-87
The Self Organising Tree Algorithm (SOTA) The Self Organising Tree Algorithm (SOTA) is a divisive hierarchical method based on a neural network SOTA,opposite to other clustering methods, grows from top to bottom: growing can be stopped at the desired level of variability SOTA nodes are weighted averages of every item under the node SOTA