Download
1 / 12
200 likes | 687 Views
Chlorine Contact Time / Virus & Giardia Log Removal Credit Calculations. The EPA Guidance Manual on the Surface water Treatment Rule and Disinfection Profiling can be downloaded at the following websites http://www.epa.gov/safewater/mdbp/lt1eswtr.html

E N D
Chlorine Contact Time / Virus & Giardia Log Removal Credit Calculations The EPA Guidance Manual on the Surface water Treatment Rule and Disinfection Profiling can be downloaded at the following websites http://www.epa.gov/safewater/mdbp/lt1eswtr.html http://www.epa.gov/ogwdw000/mdbp/pdf/profile/lt1profiling.pdf The sample excel sheet for calculating log removal credits can be downloaded from the following site http://www.epa.gov/safewater/mdbp/lt1/xls/profile_benchmark_calculator_short.xls 1
State (CDPH) Regulations on Surface Water Treatment The California Surface water Treatment Rule can be found in CALIFORNIA CODE OF REGULATIONS. TITLE 22. SOCIAL SECURITY DIVISION 4. ENVIRONMENTAL HEALTH CHAPTER 17. SURFACE WATER TREATMENT § 64652. Treatment Requirements and Compliance Options. (a) Each supplier using an approved surface water shall provide multibarrier treatment that meets the requirements of this chapter and reliably ensures at least: (1) A total of 99.9 percent reduction of Giardia lambliacysts through filtration and disinfection; and (2) A total of 99.99 percent reduction or viruses through filtration and disinfection. 2
Data Required • Disinfection Segments • Type of Disinfection (Free Chlorine, Ozone etc) • Peak Flow Rate (gpm) • Residual Disinfectant Concentration (mg/L) • Temperature (Celsius) • pH (Surface water ranges from 6.5-8.5) • Contact time Volume (Contact/Storage/Pressure tank volume and volume of pipe until the first user) 3
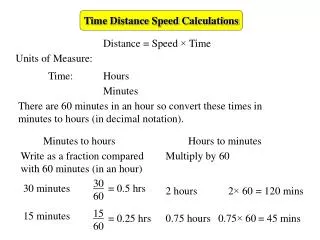
Calculate CT (Concentration contact Time) Total Detention Time (TDT) = Lowest Operating Volume / Peak Flow Lowest operating volume should be taken during peak hour demand. Contact Time = TDT X Baffling Factor Baffling Factor can found from the following table 4
Calculate CTcalc CTcalc (minutes-mg/L) = C x T C = Residual disinfectant concentration measured during peak hourly flow in mg/L. T = Contact Time, measured in minutes, that the water is in contact with the disinfectant. 6
Log Reduction Log reduction relates to the percentage of microorganisms physically removed or inactivated by a given process. • 1-log reduction = 90% • 2-log reduction = 99% • 3-log reduction = 99.9% • 4-log reduction = 99.99% Surface water treatment requires a 3-log removal for Giardia and 4-log removal for viruses. 7
Inactivation Ratio Inactivation Ratio = CTcalc / CTreq Actual Log Inactivation of Giardia = 3 x (CTcalc / CTreq) Actual Log Inactivation of Viruses = 4 x (CTcalc / CTreq) 11